

Somebody Loves this Album - Process

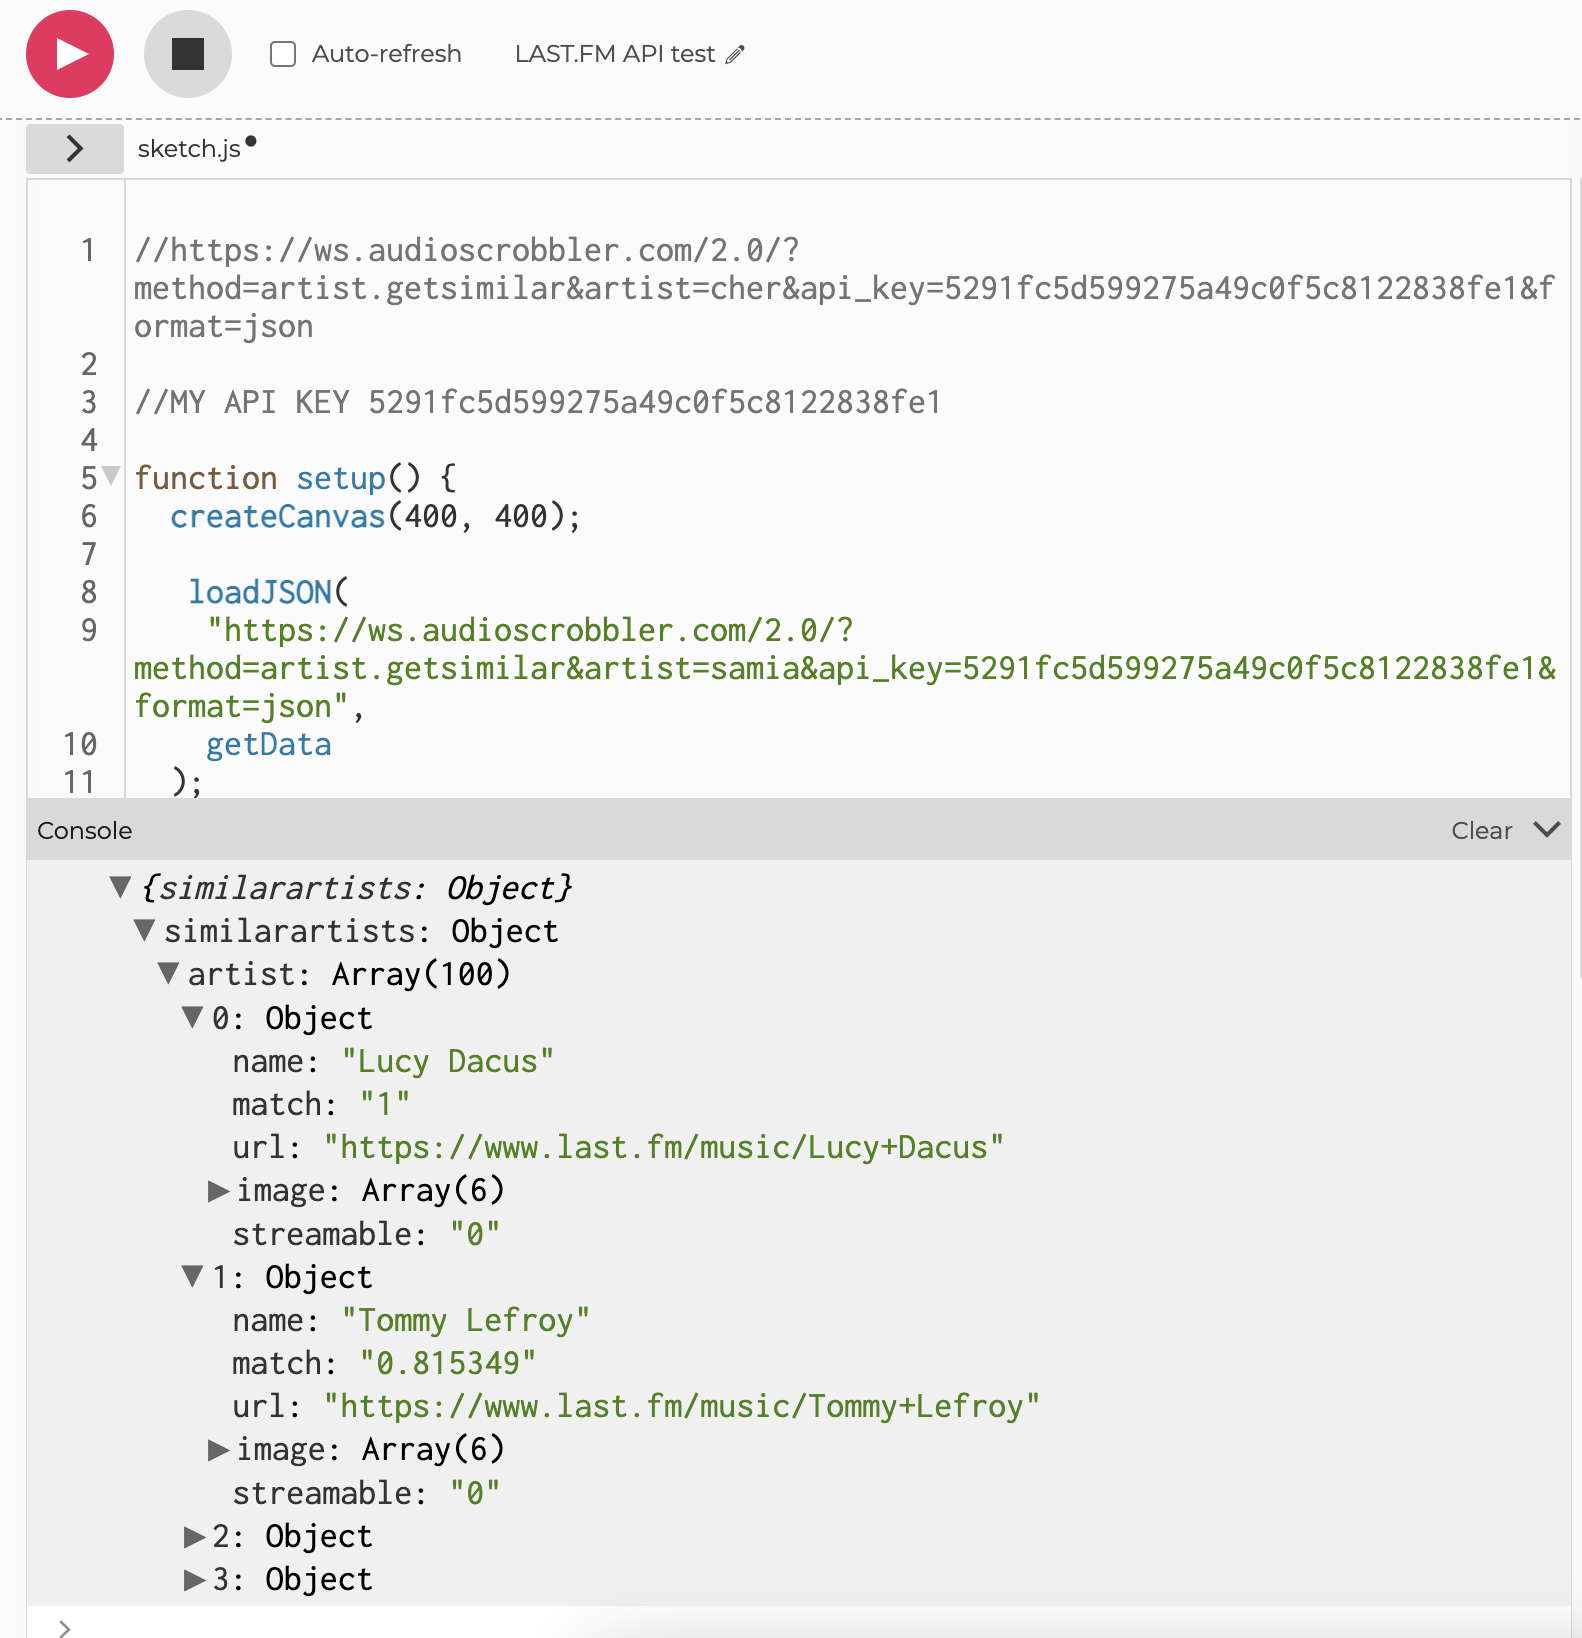
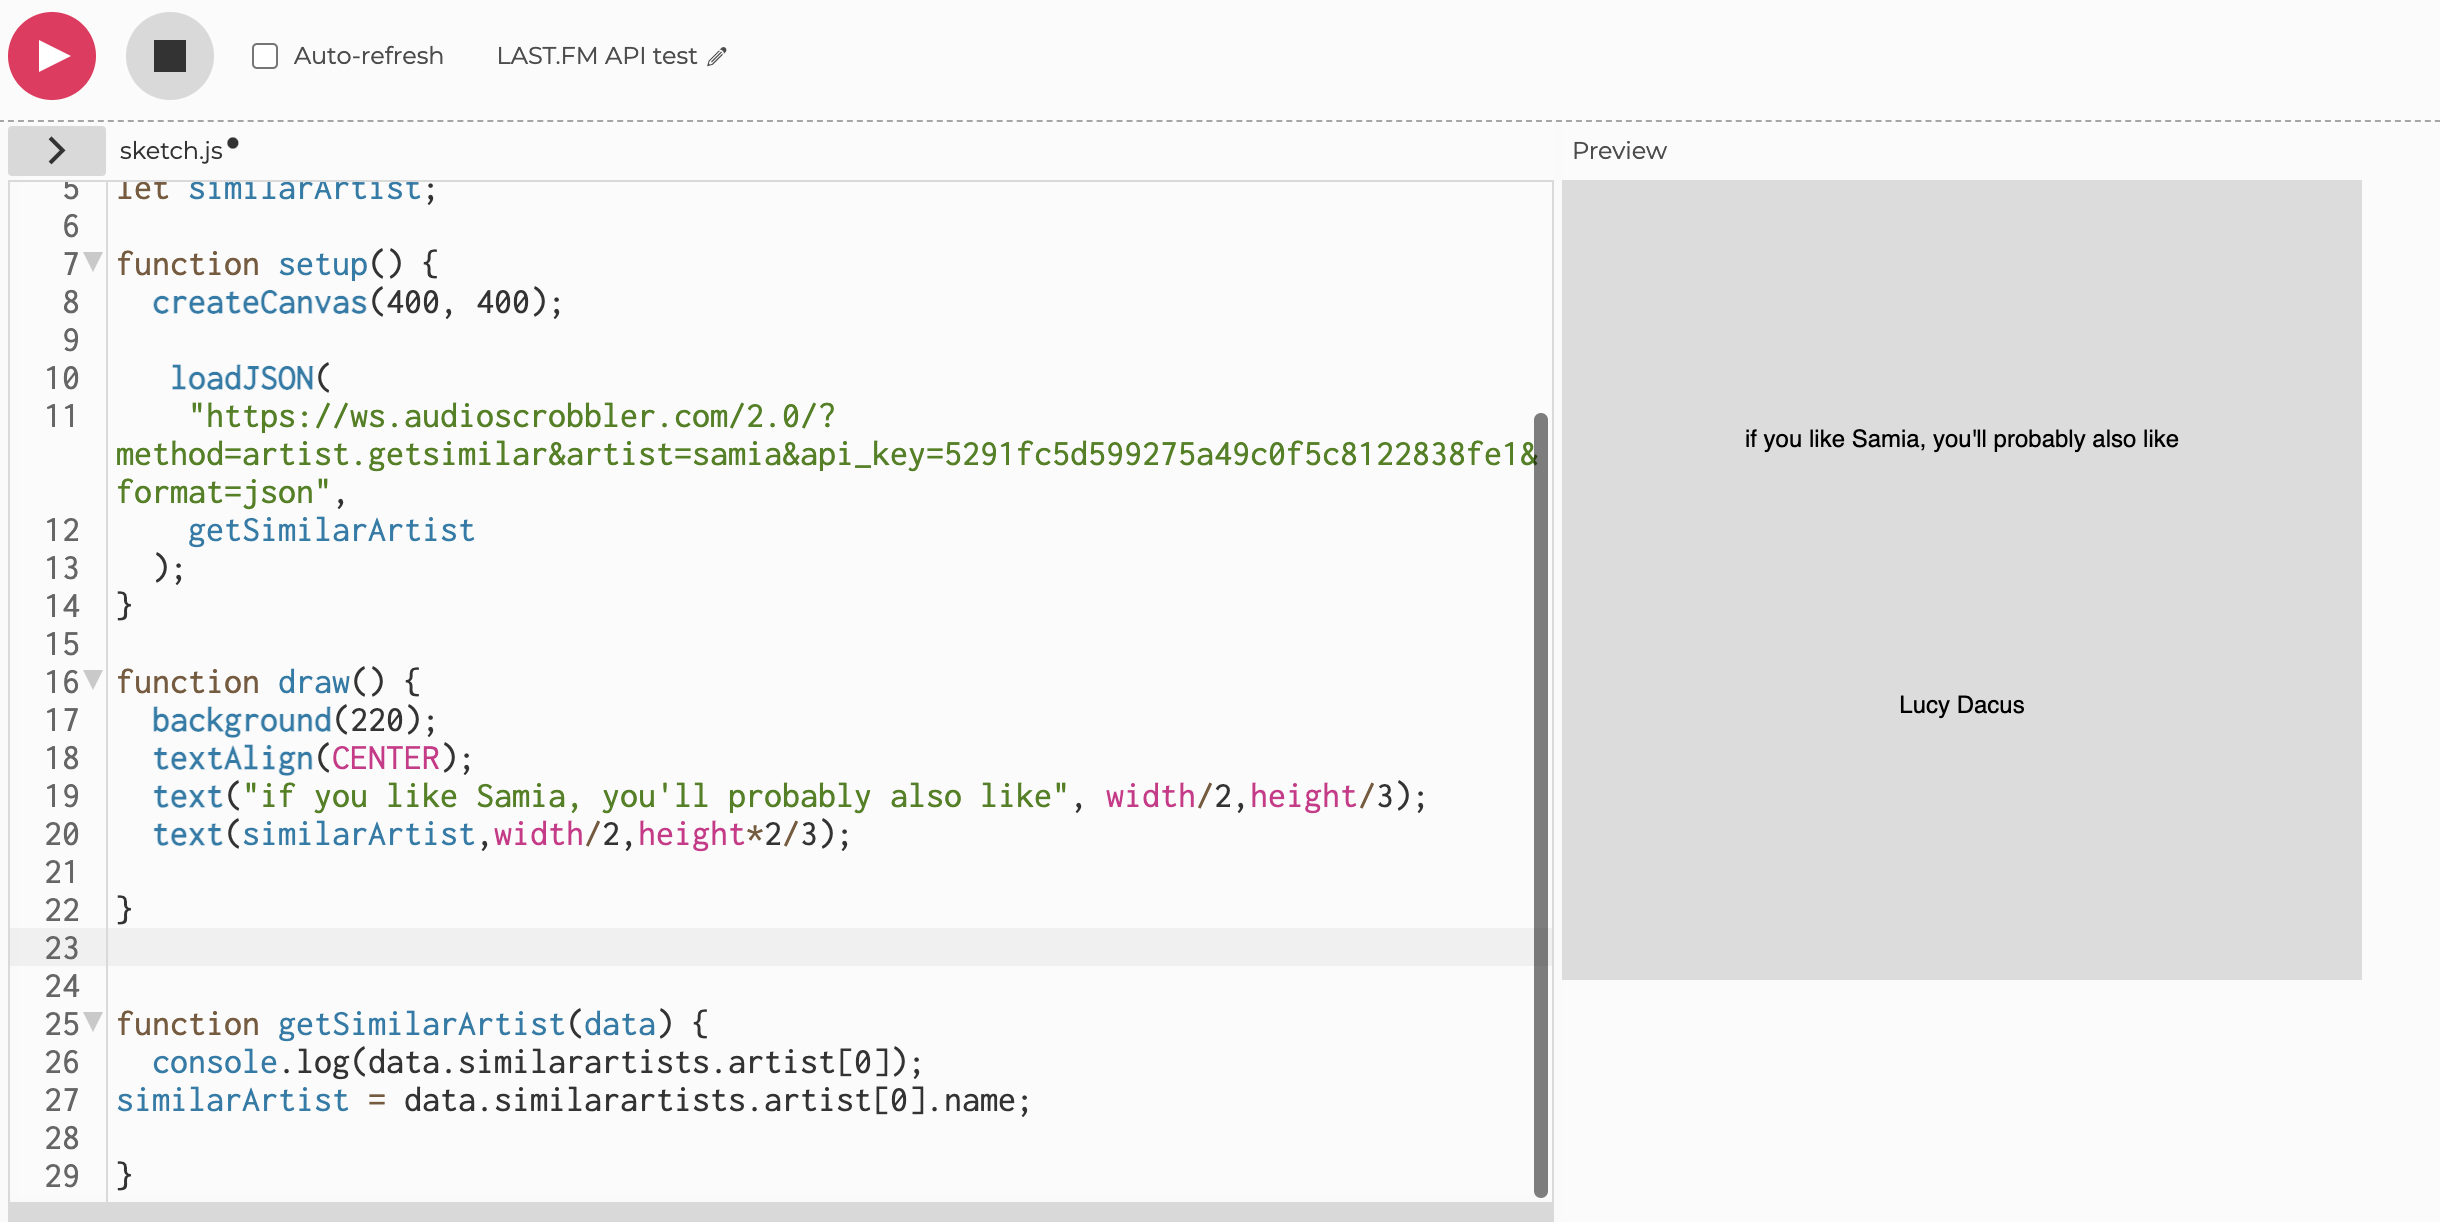
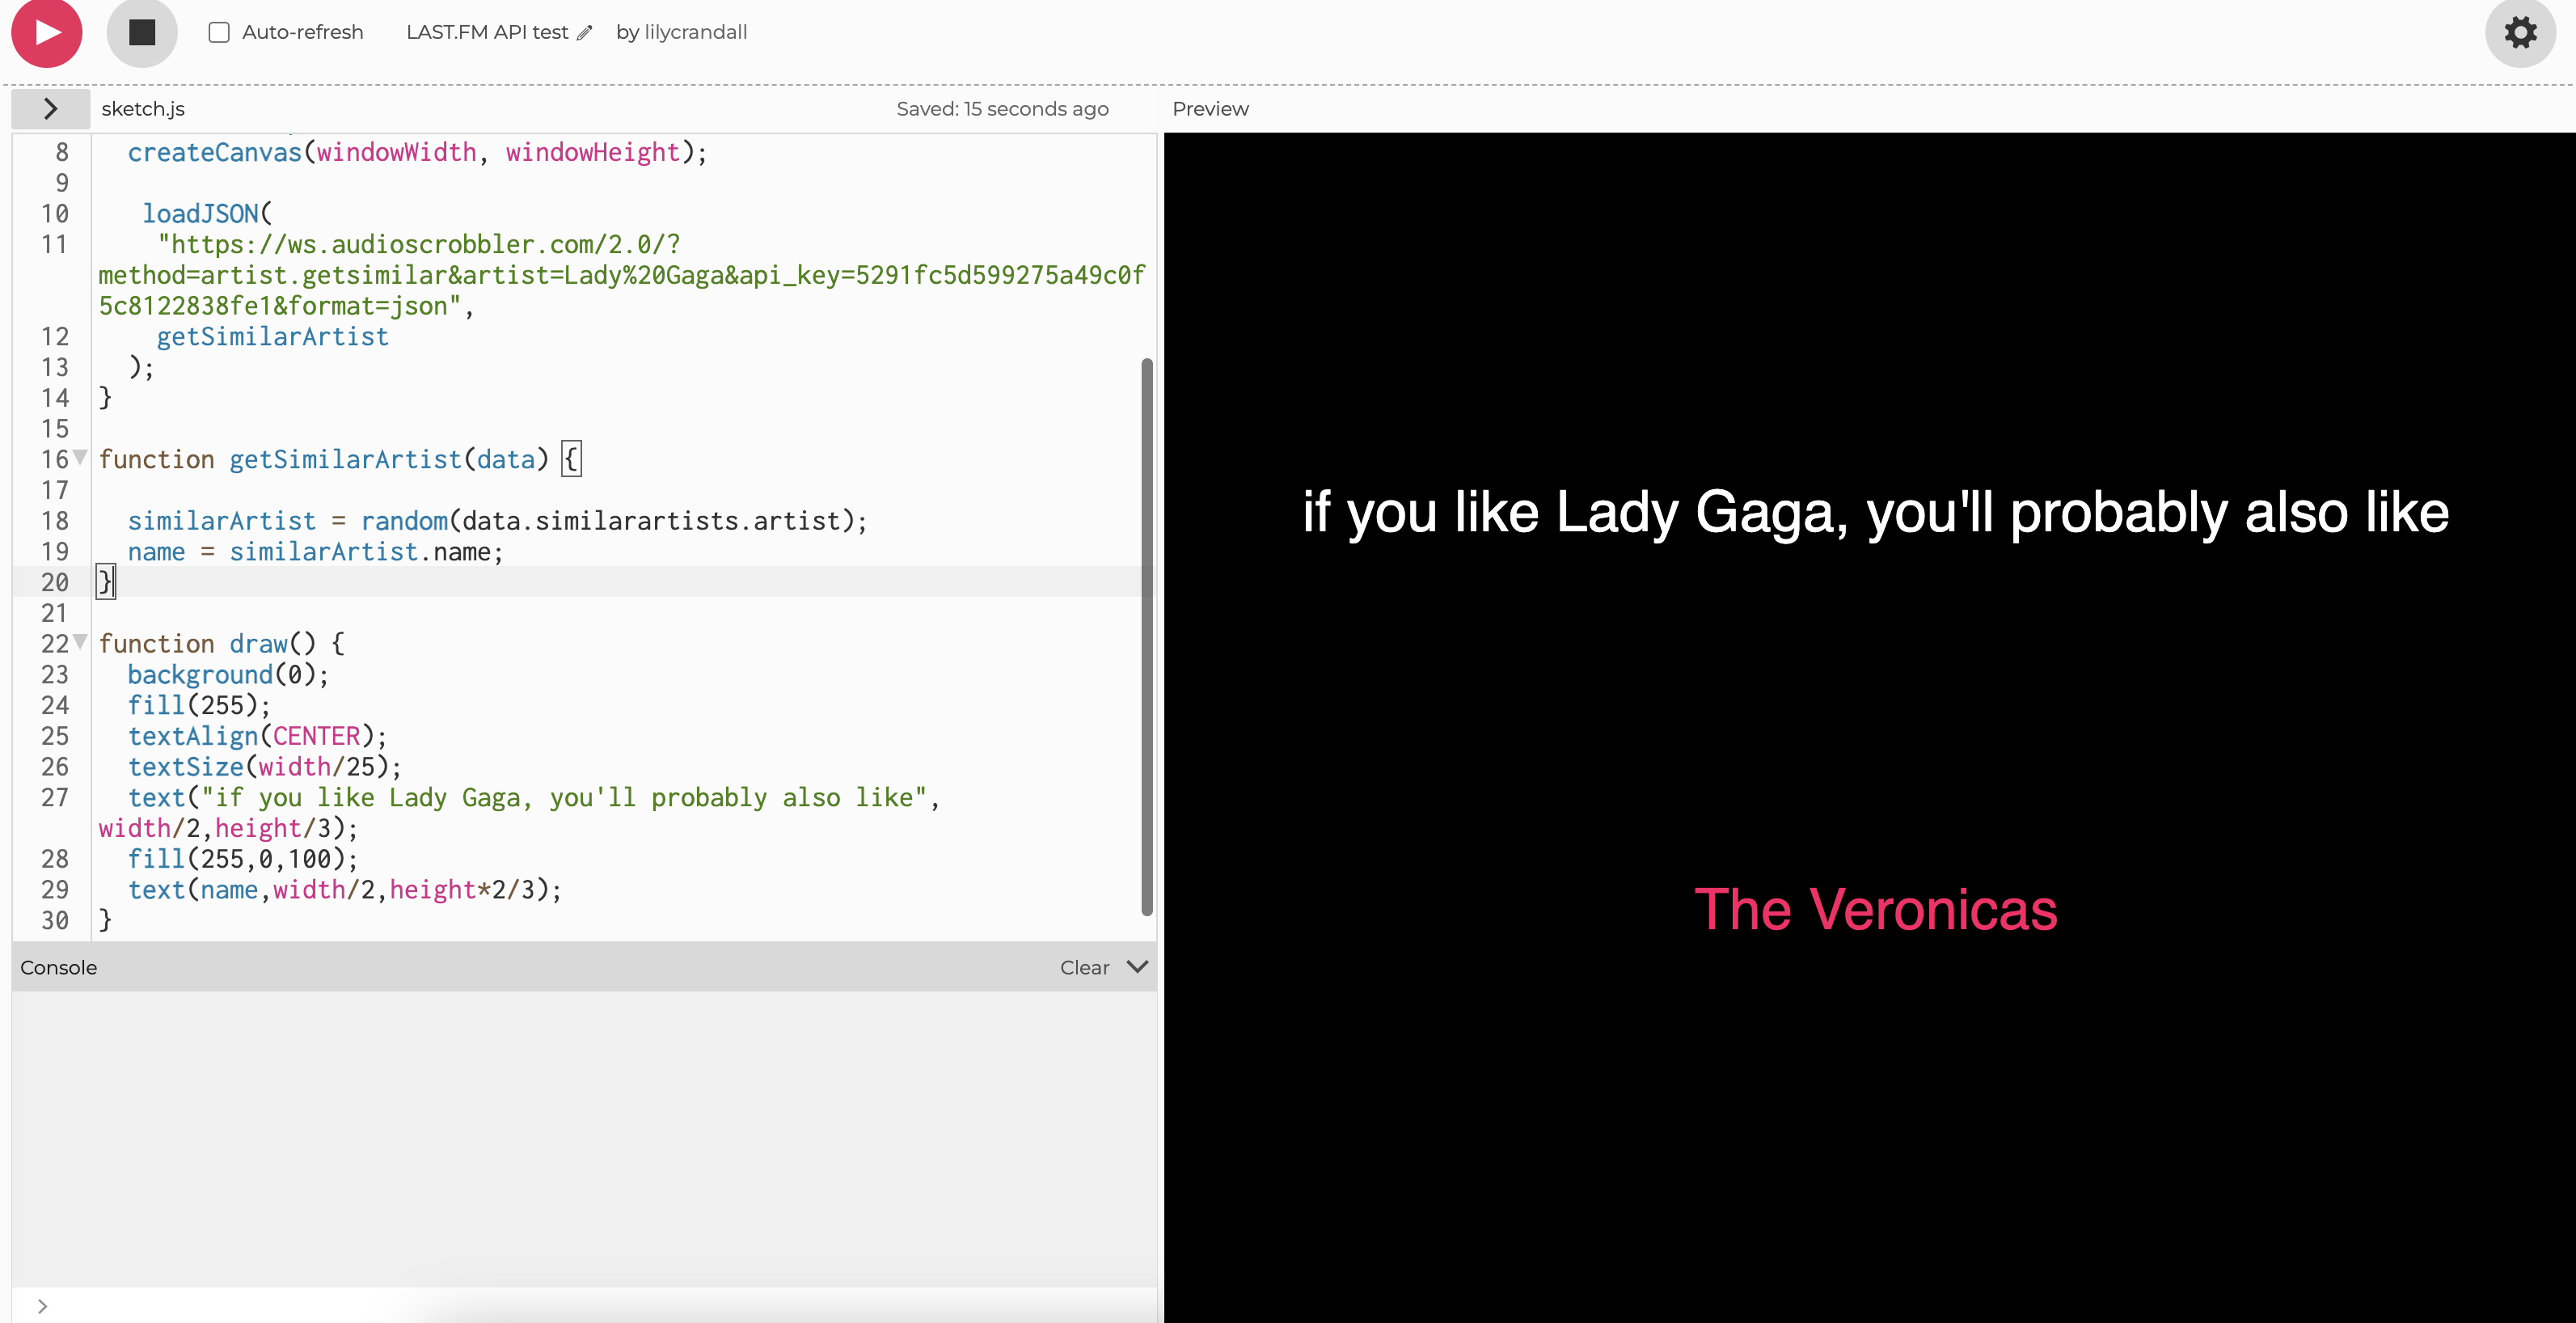
For this week, my “hello world” project is me diving into possible music APIs. The first one I tried was last.fm, at the recommendation of Sam. I used this one a few years ago for this project, and found it very easy to use. I created a new API key and used it to find similar artists to one of my favorite artists, Samia. I then plugged that info into a p5 sketch.
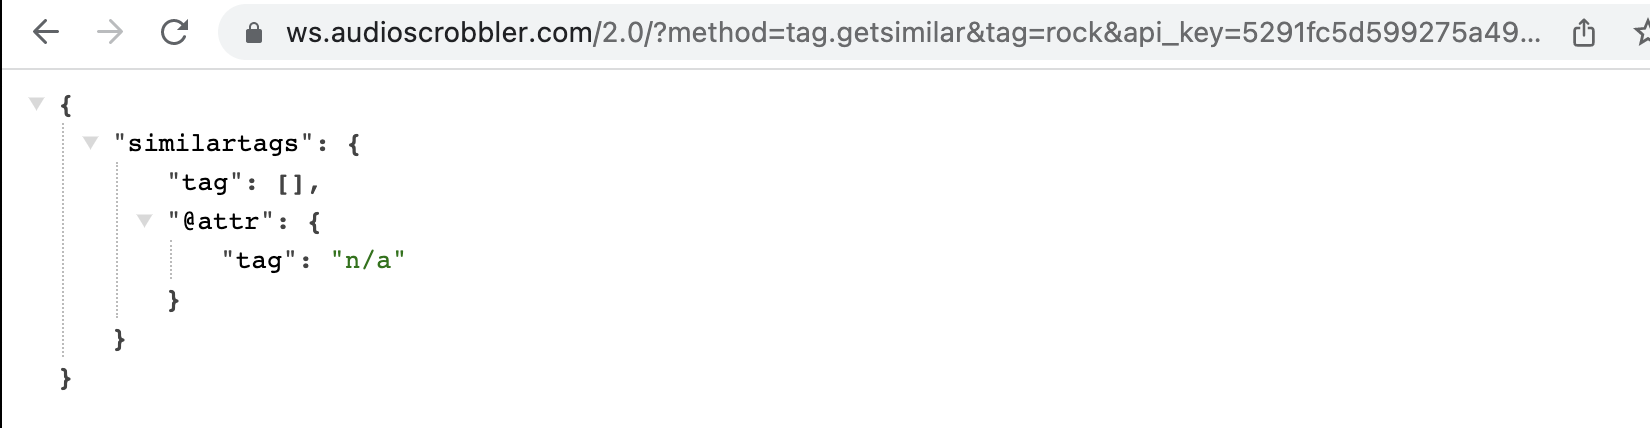
Once I got that working, I did the same with genres, which is more the direction I want to go with in this project. It didn’t work and I do not know why.
WEEK 9: USER TESTING & API PROGRESS

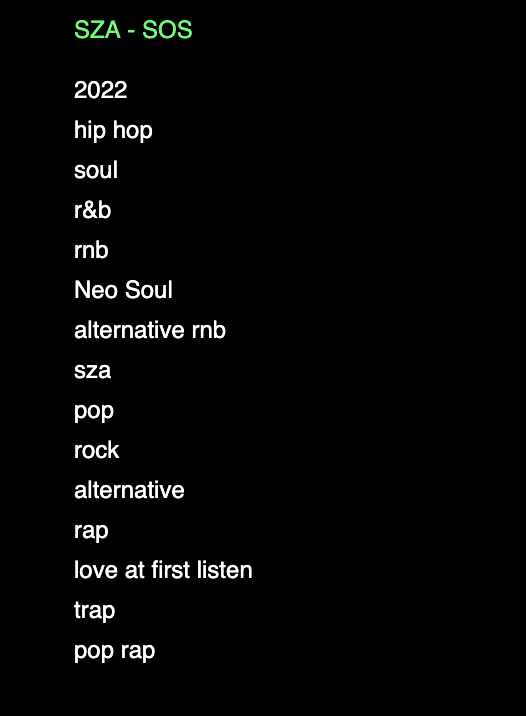
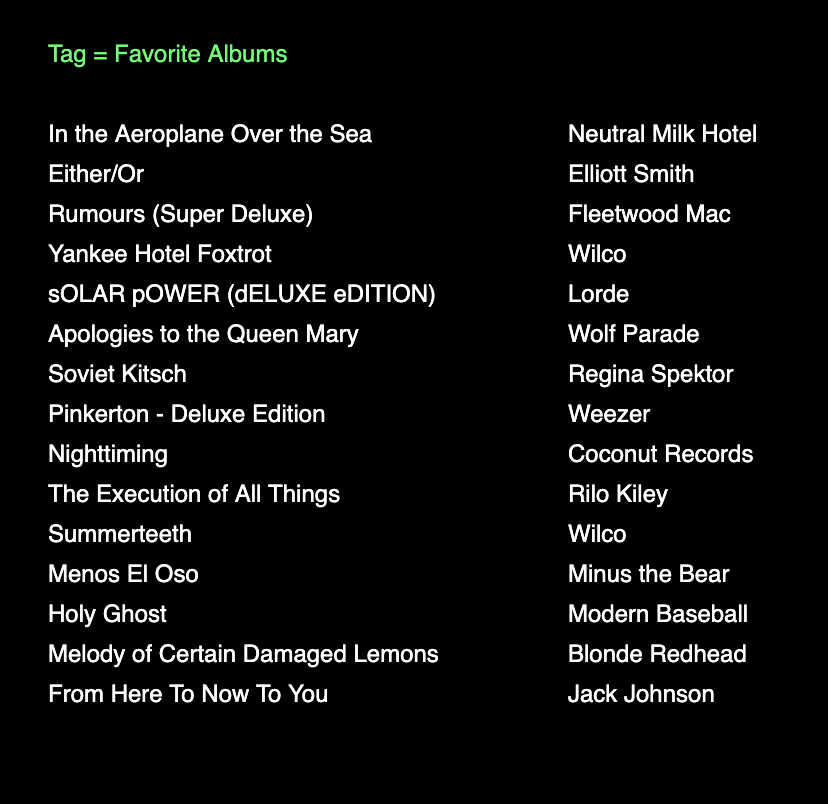
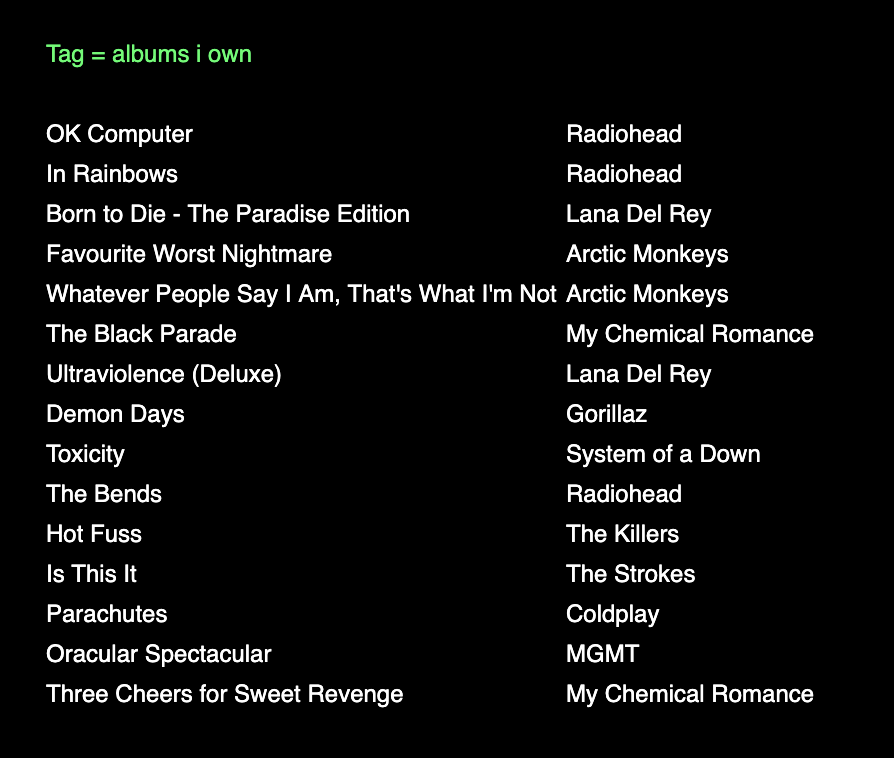
In addition to the tags I predicted, like “alternative rock” and “indie” - there were some interesting ones like “favourite albums” and “albums i own” that Last.fm users had tagged themselves. Although I wasn’t expecting these, it’s a really interesting way to see how people catalog their music. It’s something I didn’t think would be able to access. I ran a few more with albums from different genres to see what they would come up with.


Then, I plugged in a tag and got the top 15 albums that are tagged with that tag.
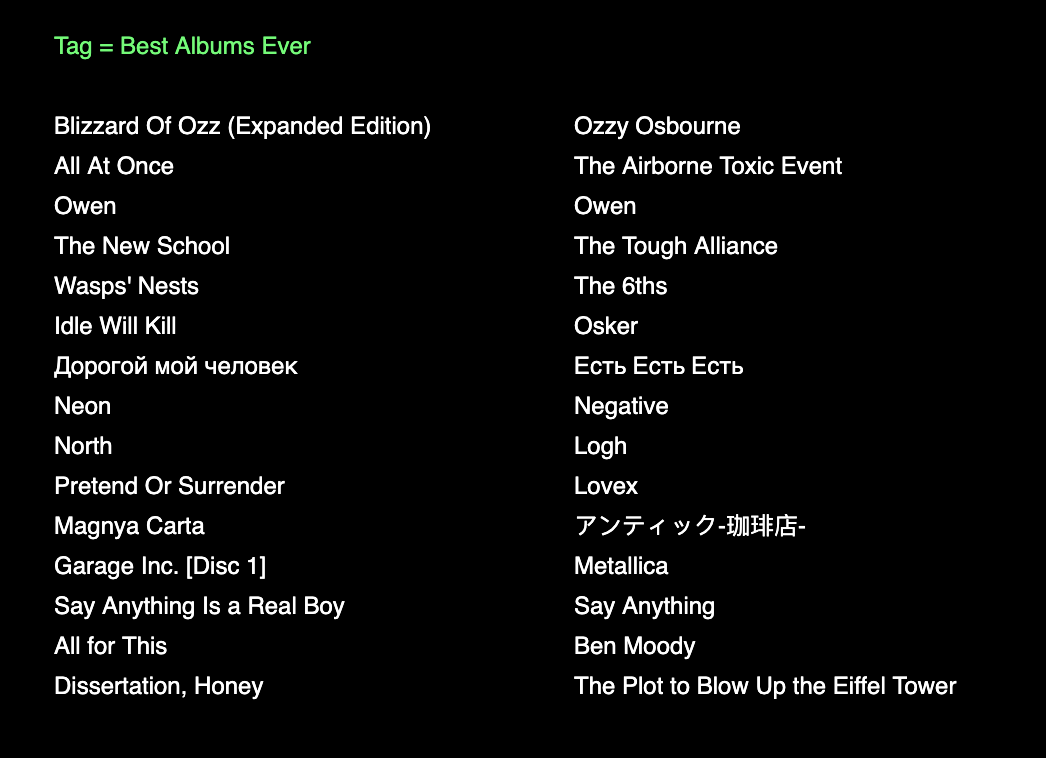
I picked 3 tags that I liked to move forward with. I’m not sure if I really want this to be the main feature of this project, but I want to explore it a little bit. I ended up going with “best album ever”, “underrated” and “love”.
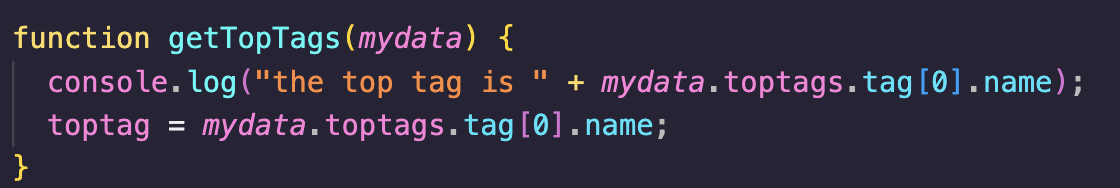
It was hard to organize my code while pulling data from 3 JSON pages. It took a lot of trial and error and I am sure my code isn’t the most organized that it could be, but it works for now, kind of.
First, I successfully got it to load the first 15 results of each page, and then pull a random album from each tag:
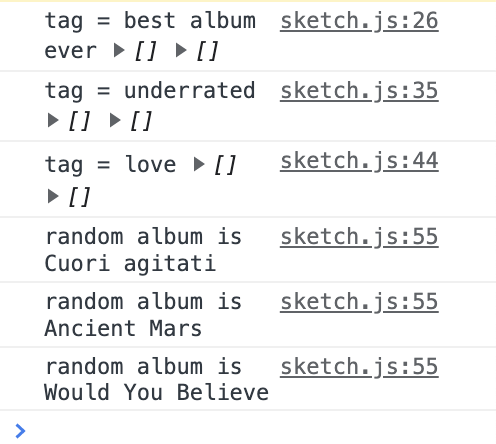
Then, I put it into draw, which ended up being more difficult than I expected. It’s hard to figure out where to set the variable of the album name & artist name so it’s only called once, and not constantly in draw. I got it to work for the first two options but didn’t have enough time for the third one. I think this is a really cool way to access data about music preference that isn’t readily available through Spotify. Like I said, I don’t know if this will be the final form of how I use this data, but I think it’s pretty cool and will probably incorporate it in some way.
WEEK 10: USER TESTING
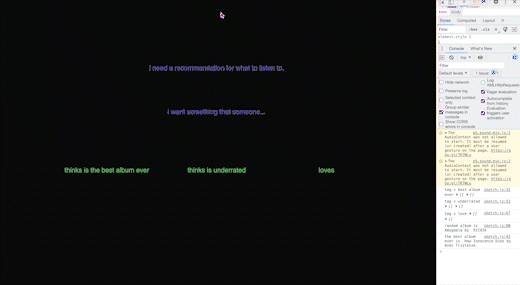
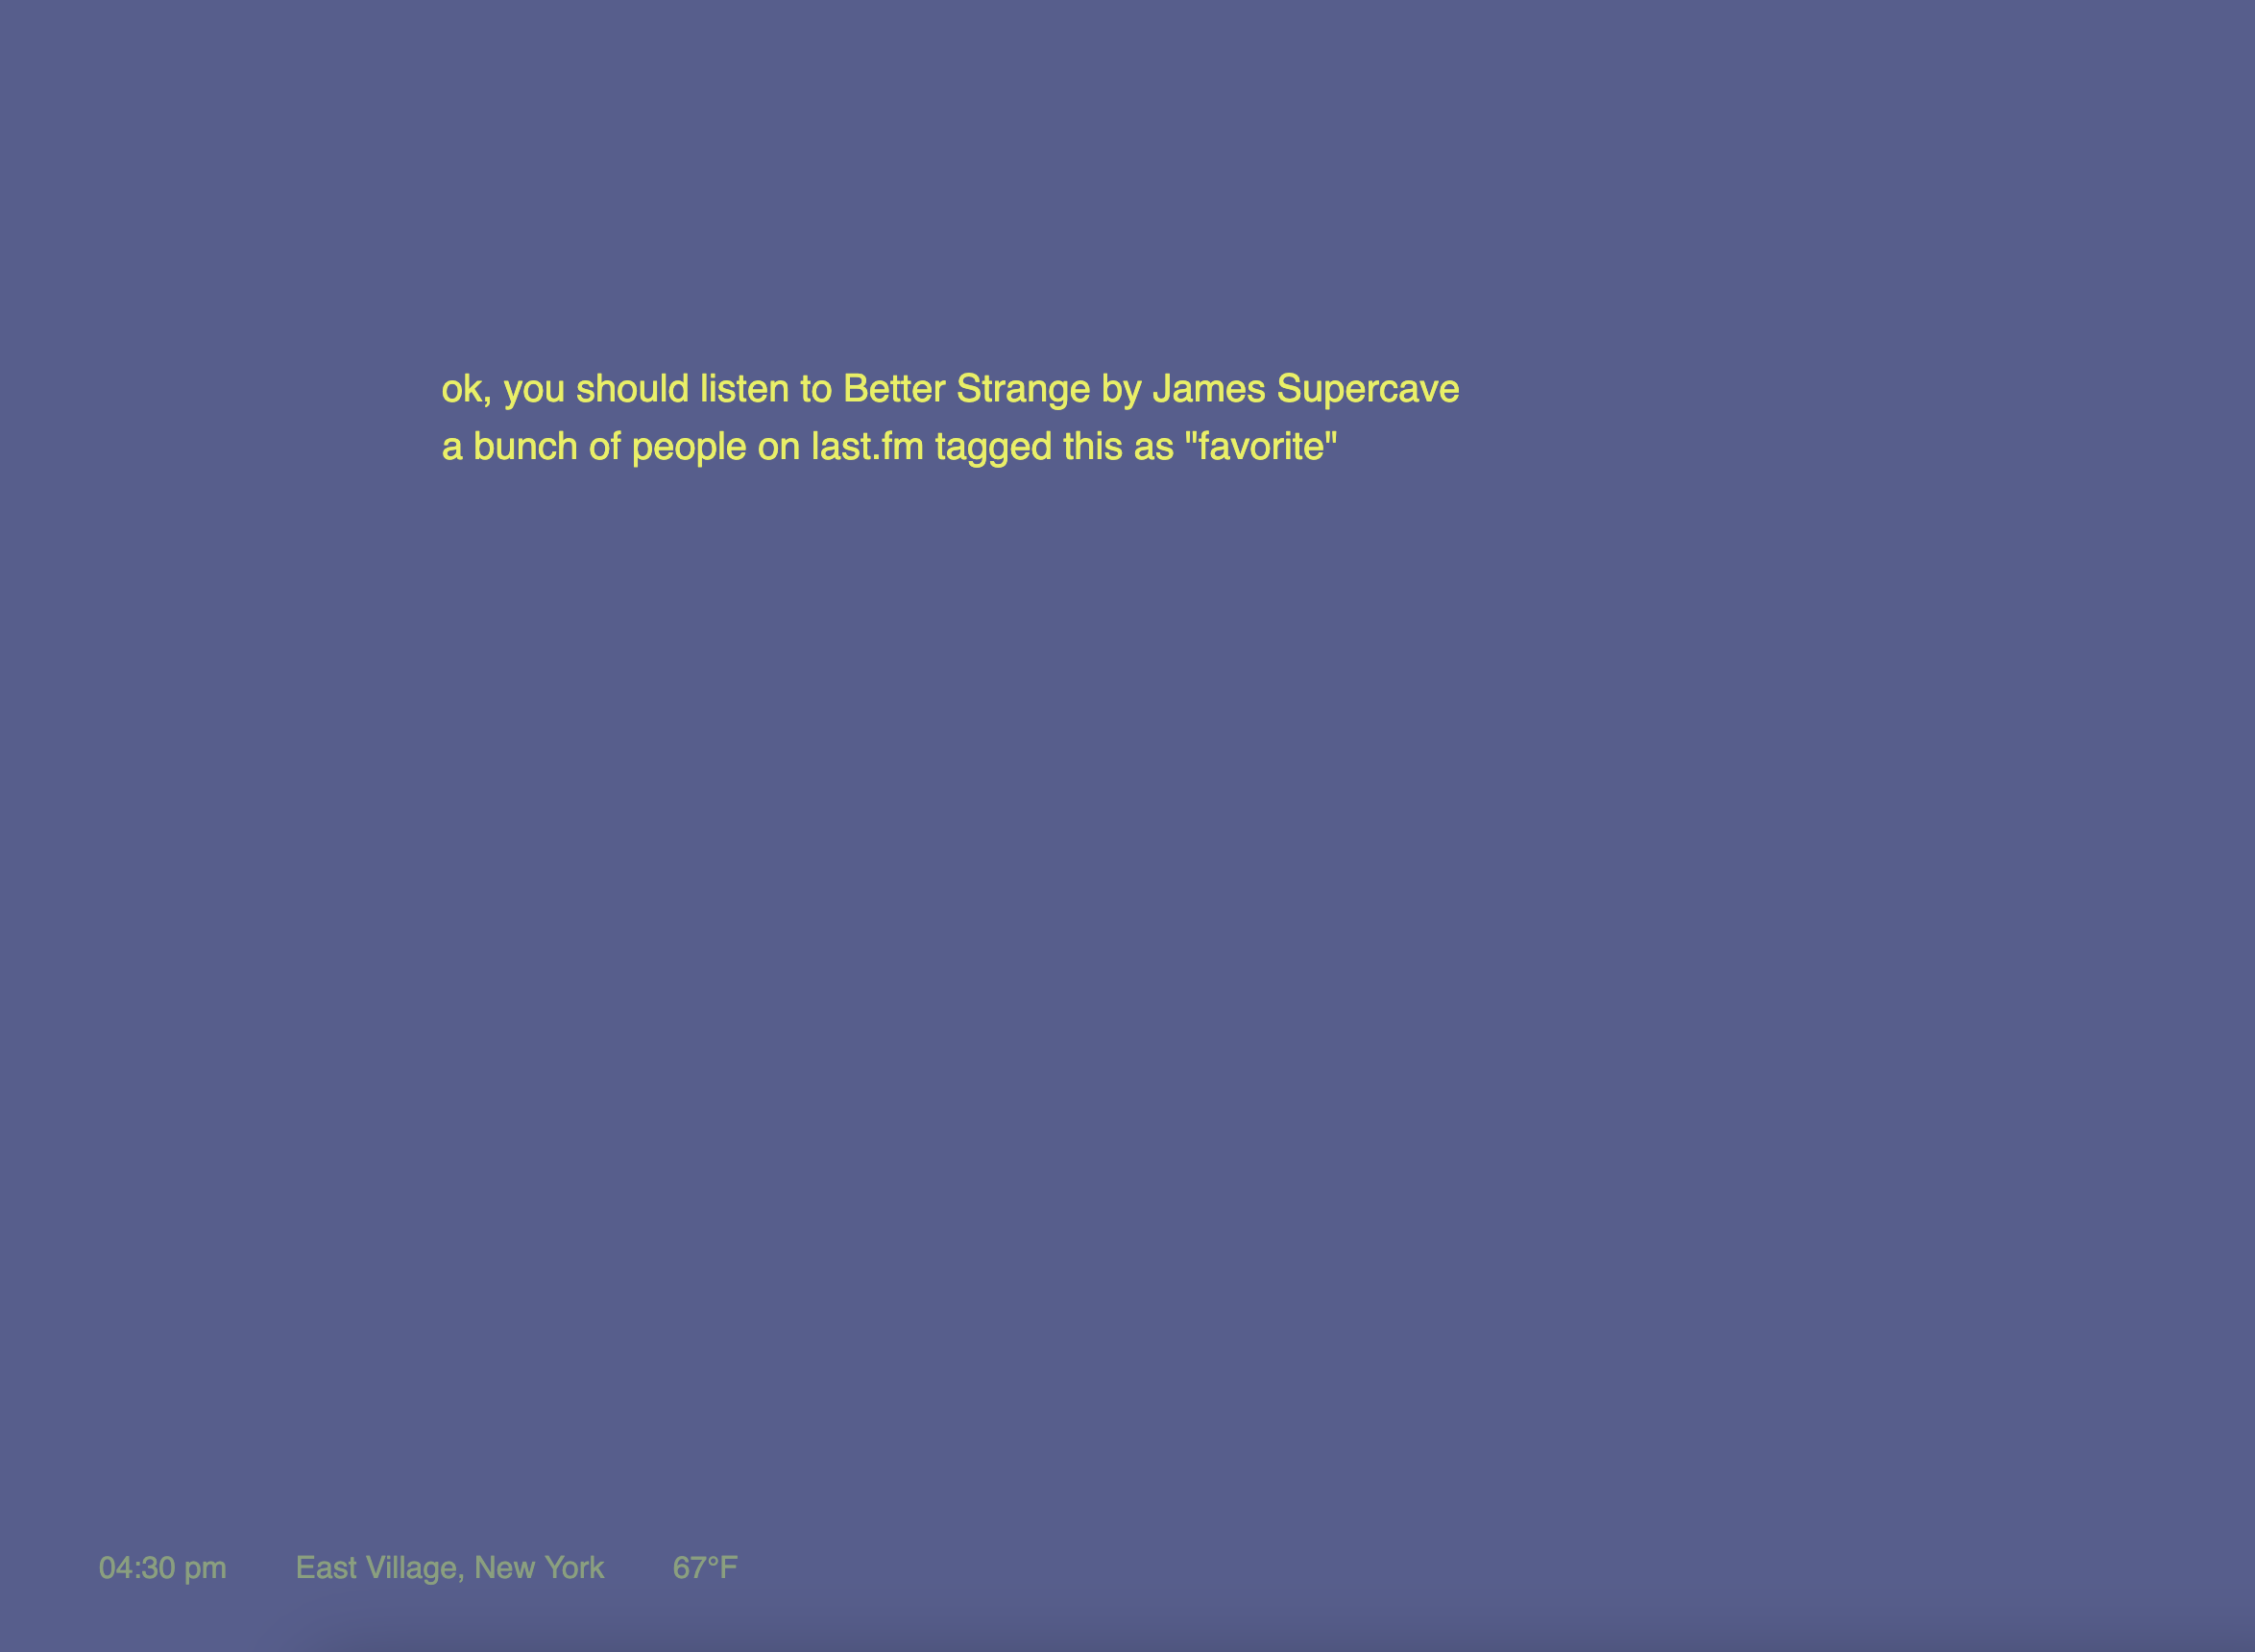
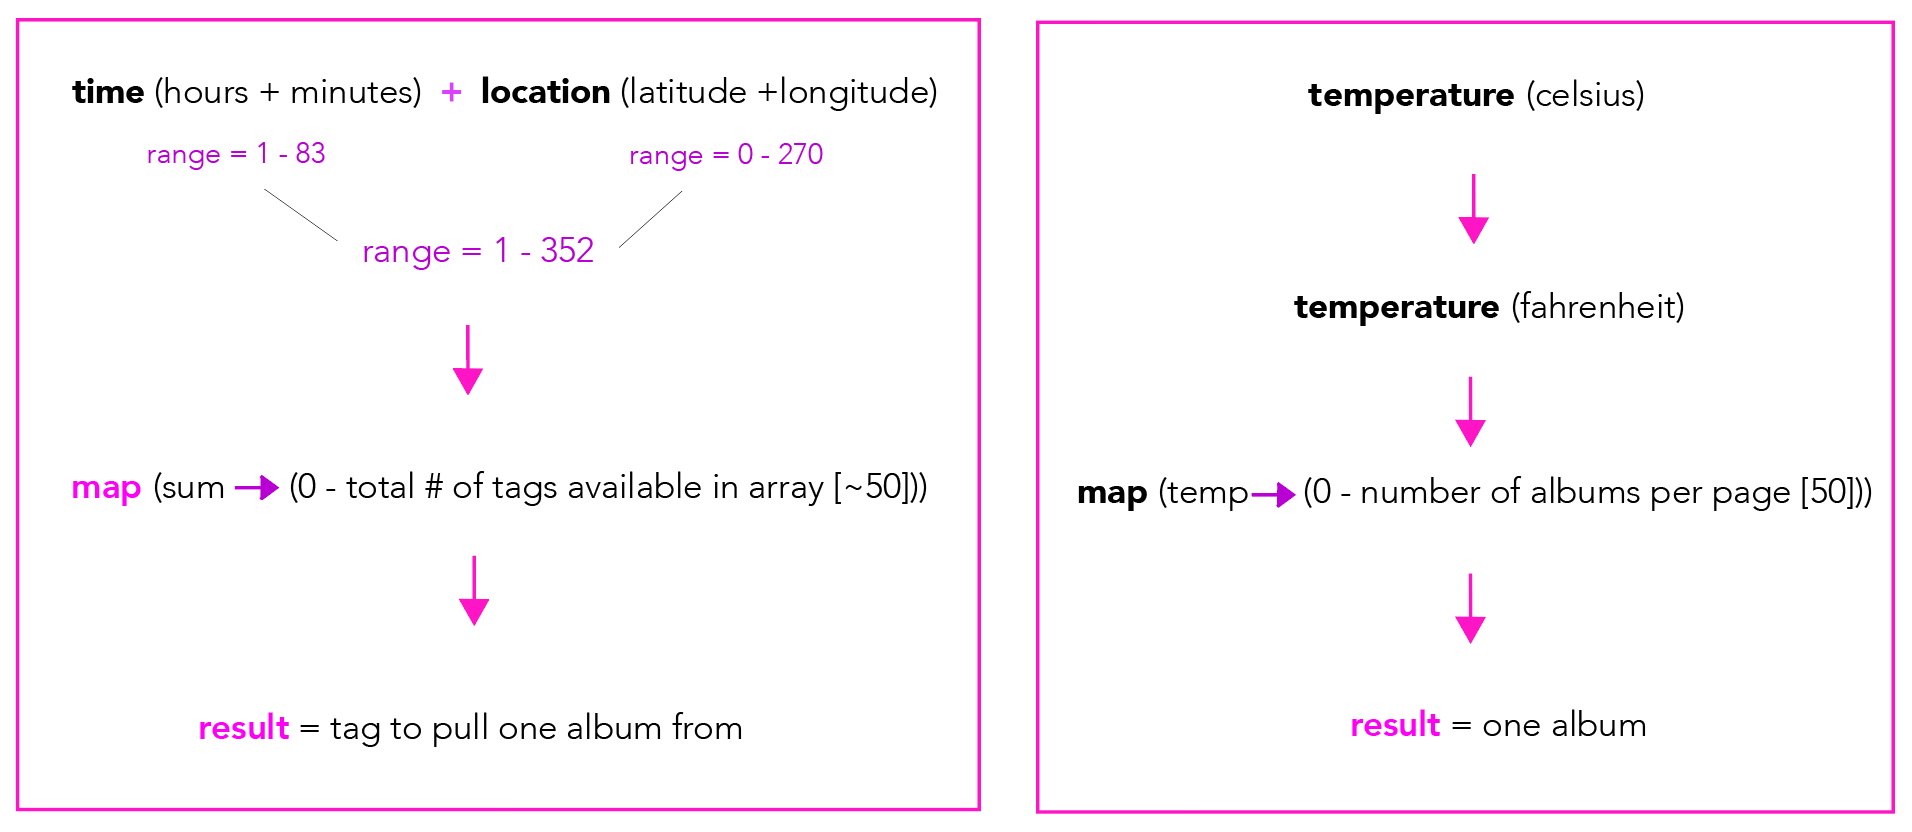
After successfully getting the API calls to work last week, I finalized my idea. Using the three parameters of temperature, time, and location, the user will be recommended an album to listen to. With those numbers set at the start of opening the sketch, they will be saved as a “key”, which will go through a series of manipulations, end up at a tag assignment, and then another series of manipulations to end up at a single album.
I got all of that data to load correctly in a sketch, and here is the outcome, with the associated key on the right.


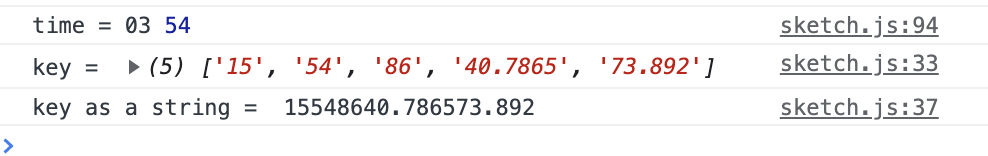
I decided to go with the 24 hour clock instead of splitting into 1-12 twice. I got all of the parametes into an array:

I also hit the request limit for the weather & location data API : (
Over the weekend, I attempted to write my own algorithm. I didn’t expect this project to include so much math. I spent some time planning it out, and figuring out the ranges for values I could get for time, temperature, and location. I spent a good deal of time getting this data to load correctly.
Some highlights:
I knew I wanted to use some of the numbers to calculate a tag to pull an album from, so I tested out some possible tags I could use. I made this list of 35 tags that had at least 1 page of 50 results of albums.

I put this into an array in my sketch to call upon later. After a lot of testing, I ended up with this general algorithm:
- The hour + minute in the time when the sketch is opened is saved, and the two values are added together. Then, that number is mapped to 0 to 50, which is the number of tags the final array will have. That determines the tag that the album is pulled from.
- The temperature is mapped to 0 to 50 as well, and that determines the spot in the top 50 albums in that tag.
What I need to do:
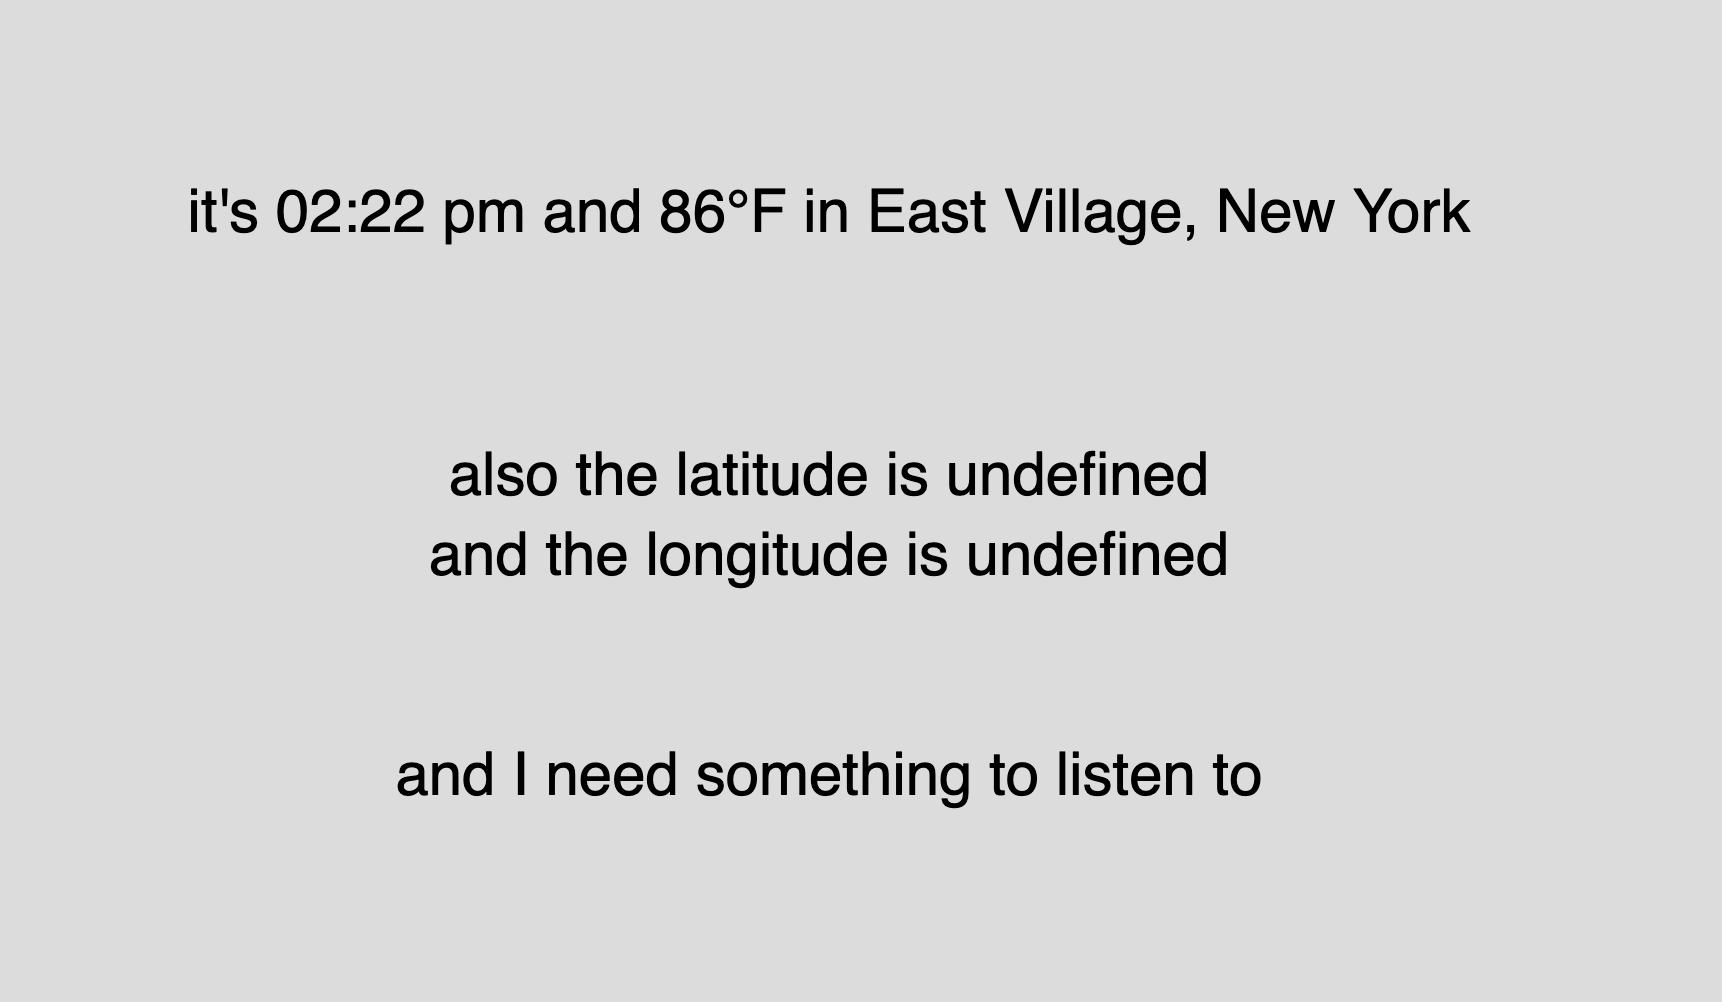
- Incoportate the latitude and longitude information. It’s difficult because there is such a large range of values.
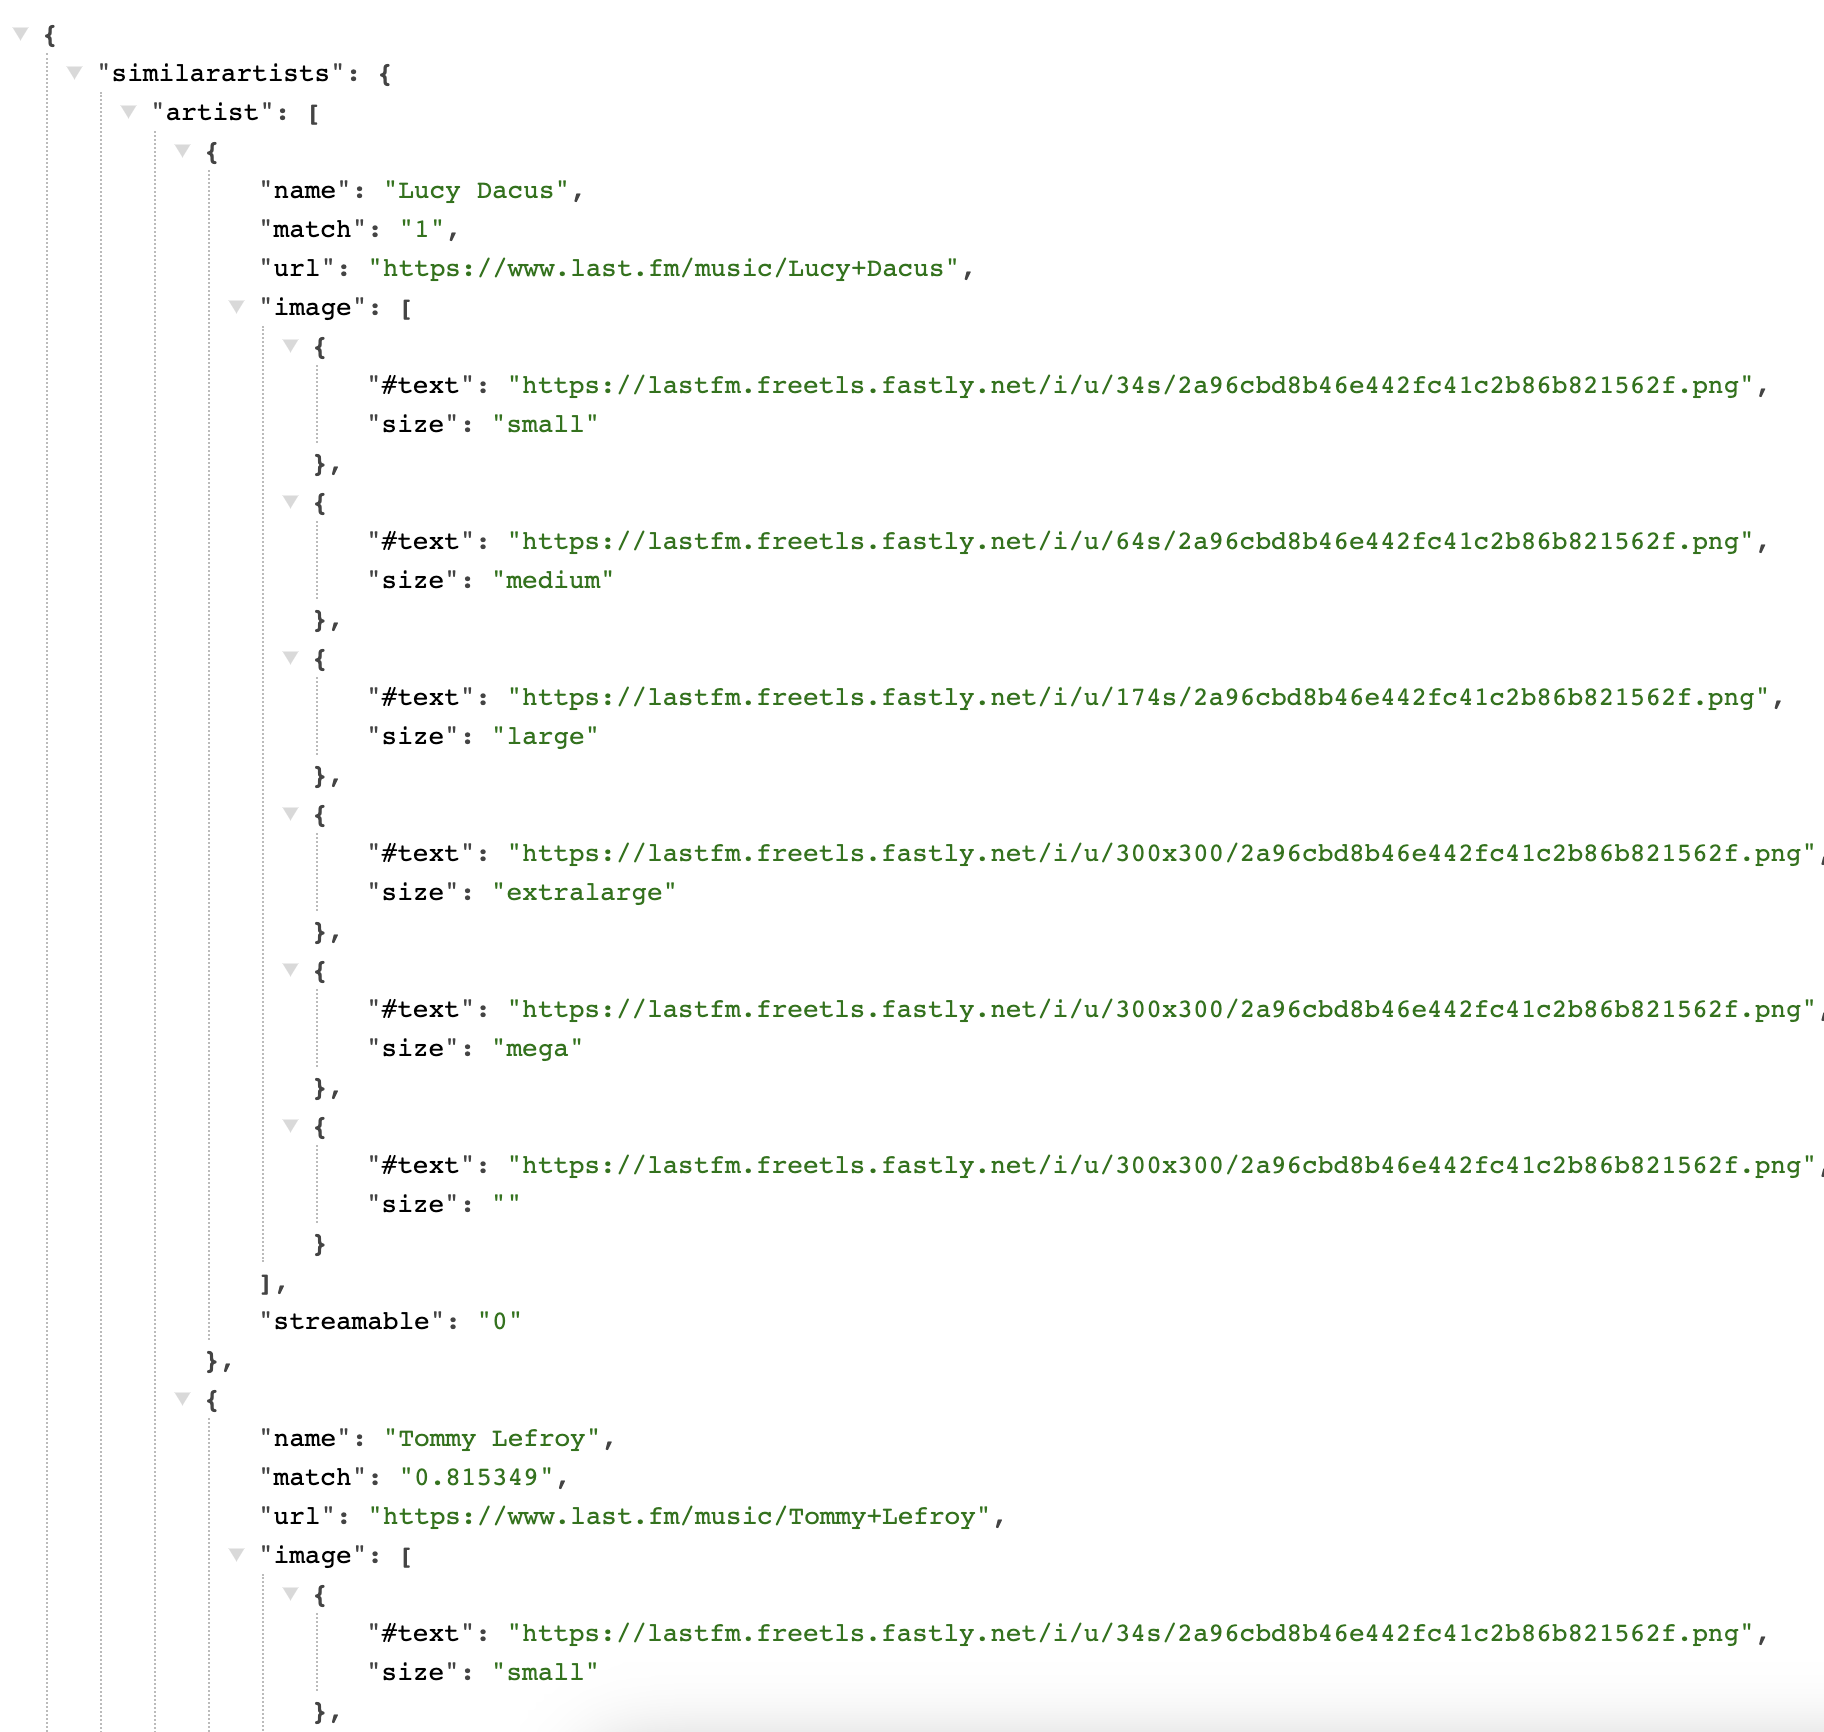
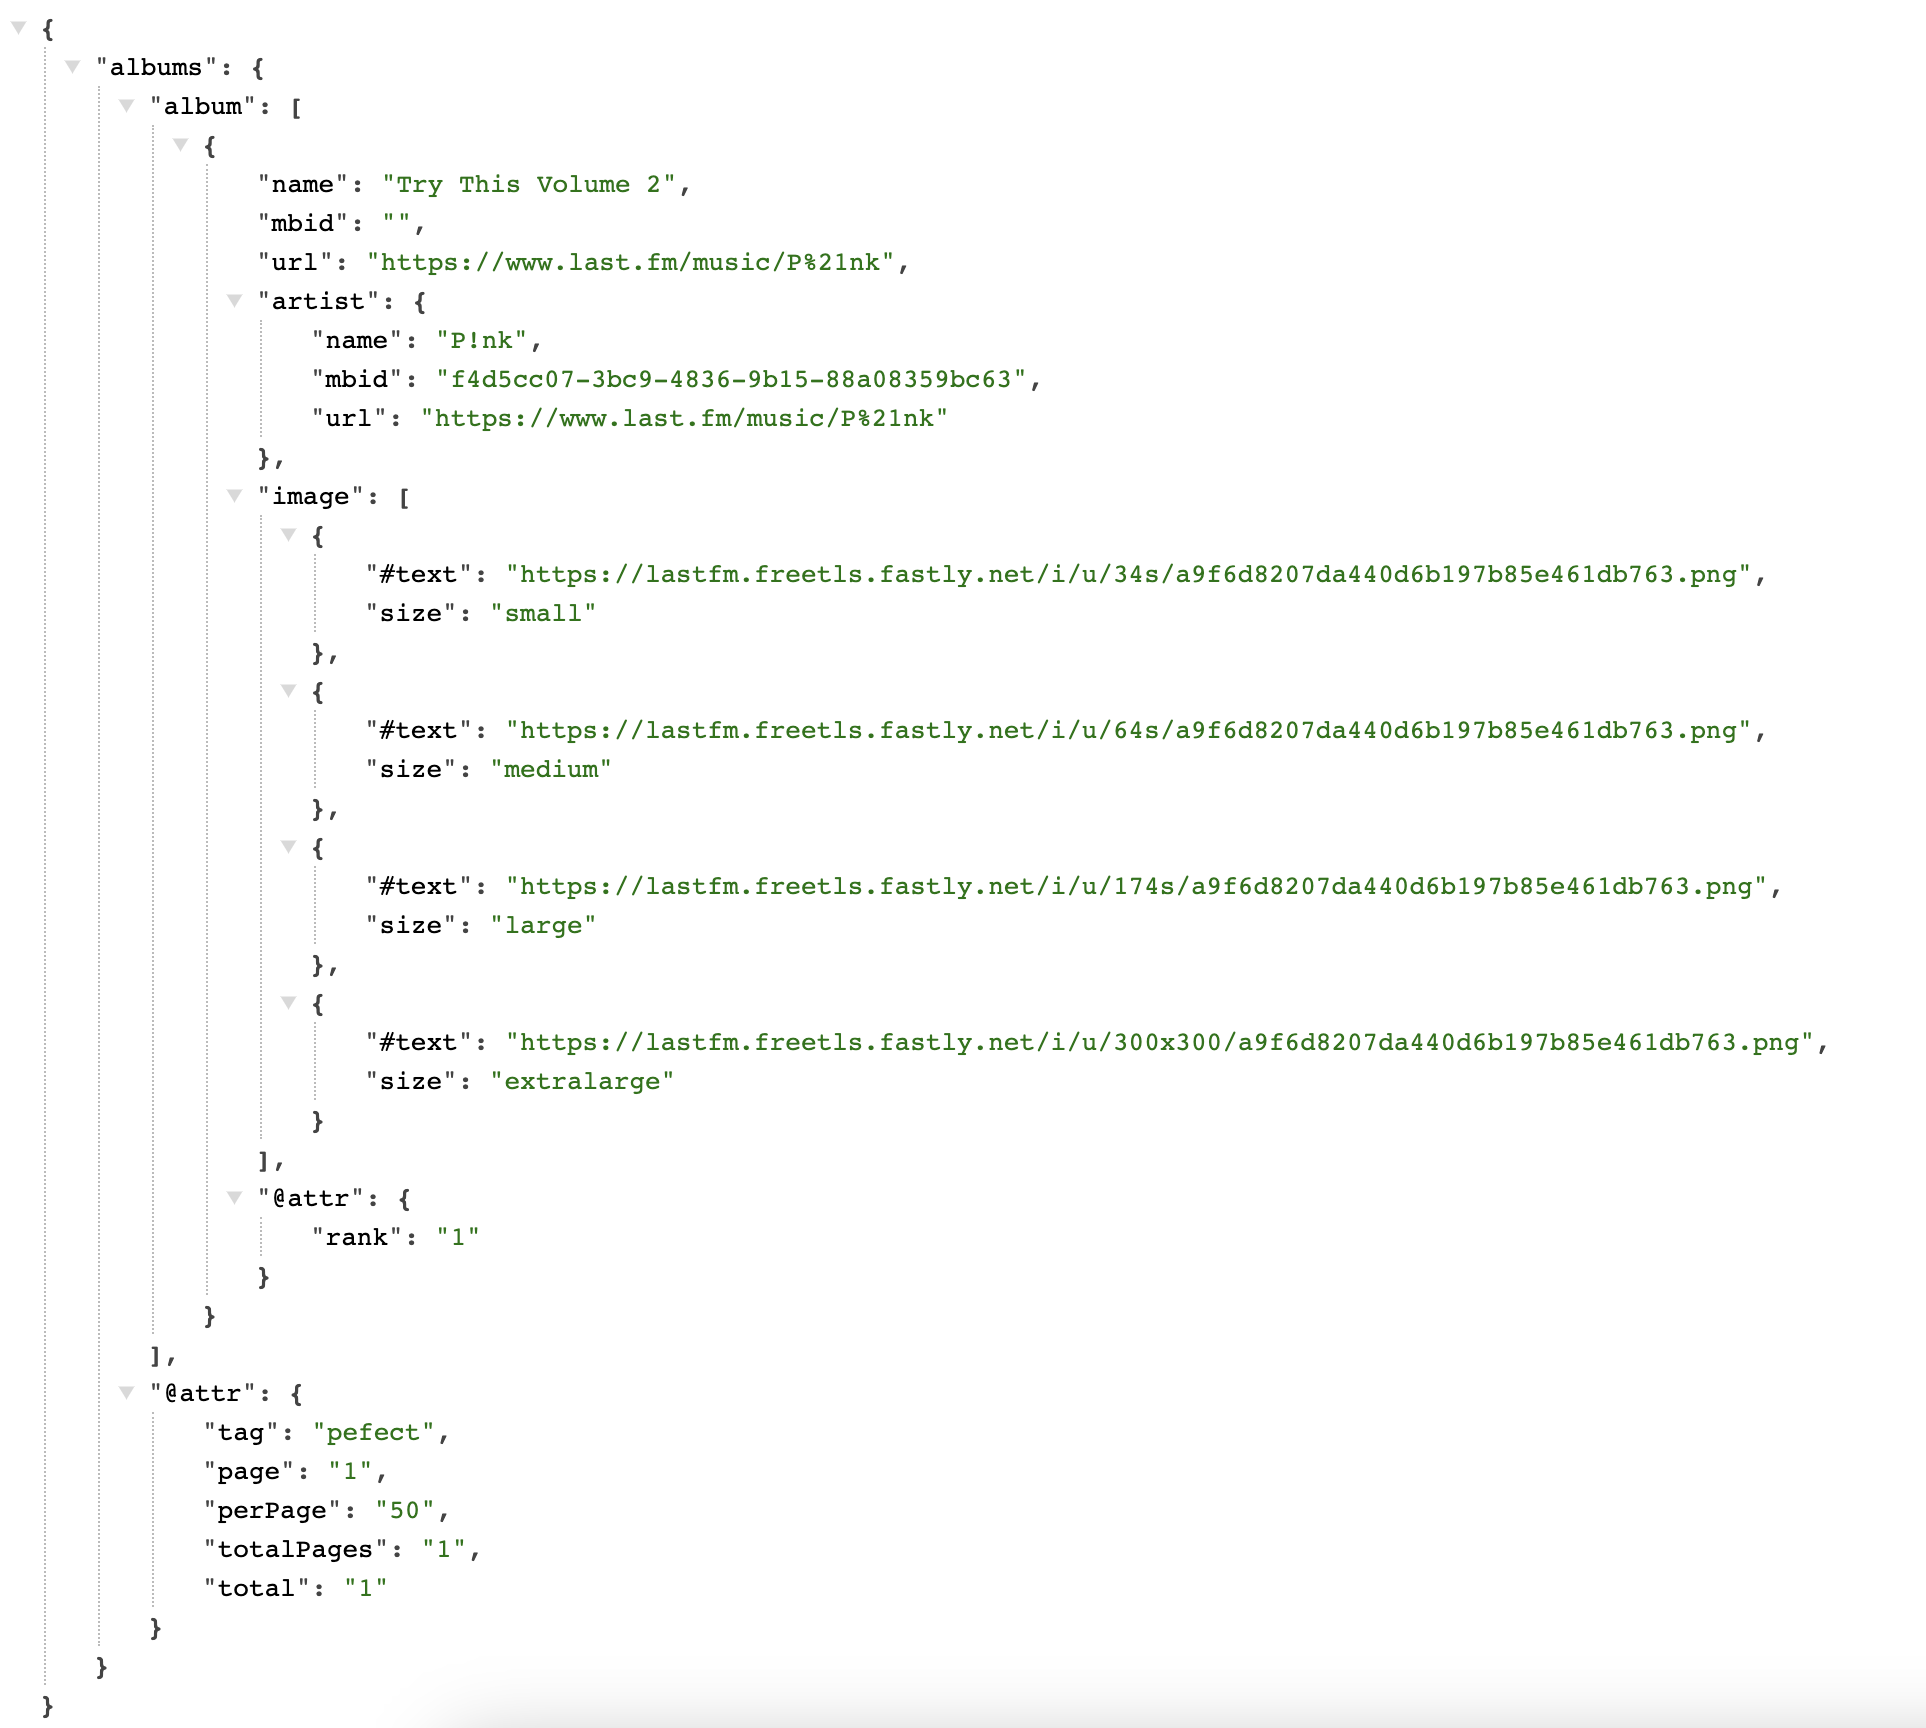
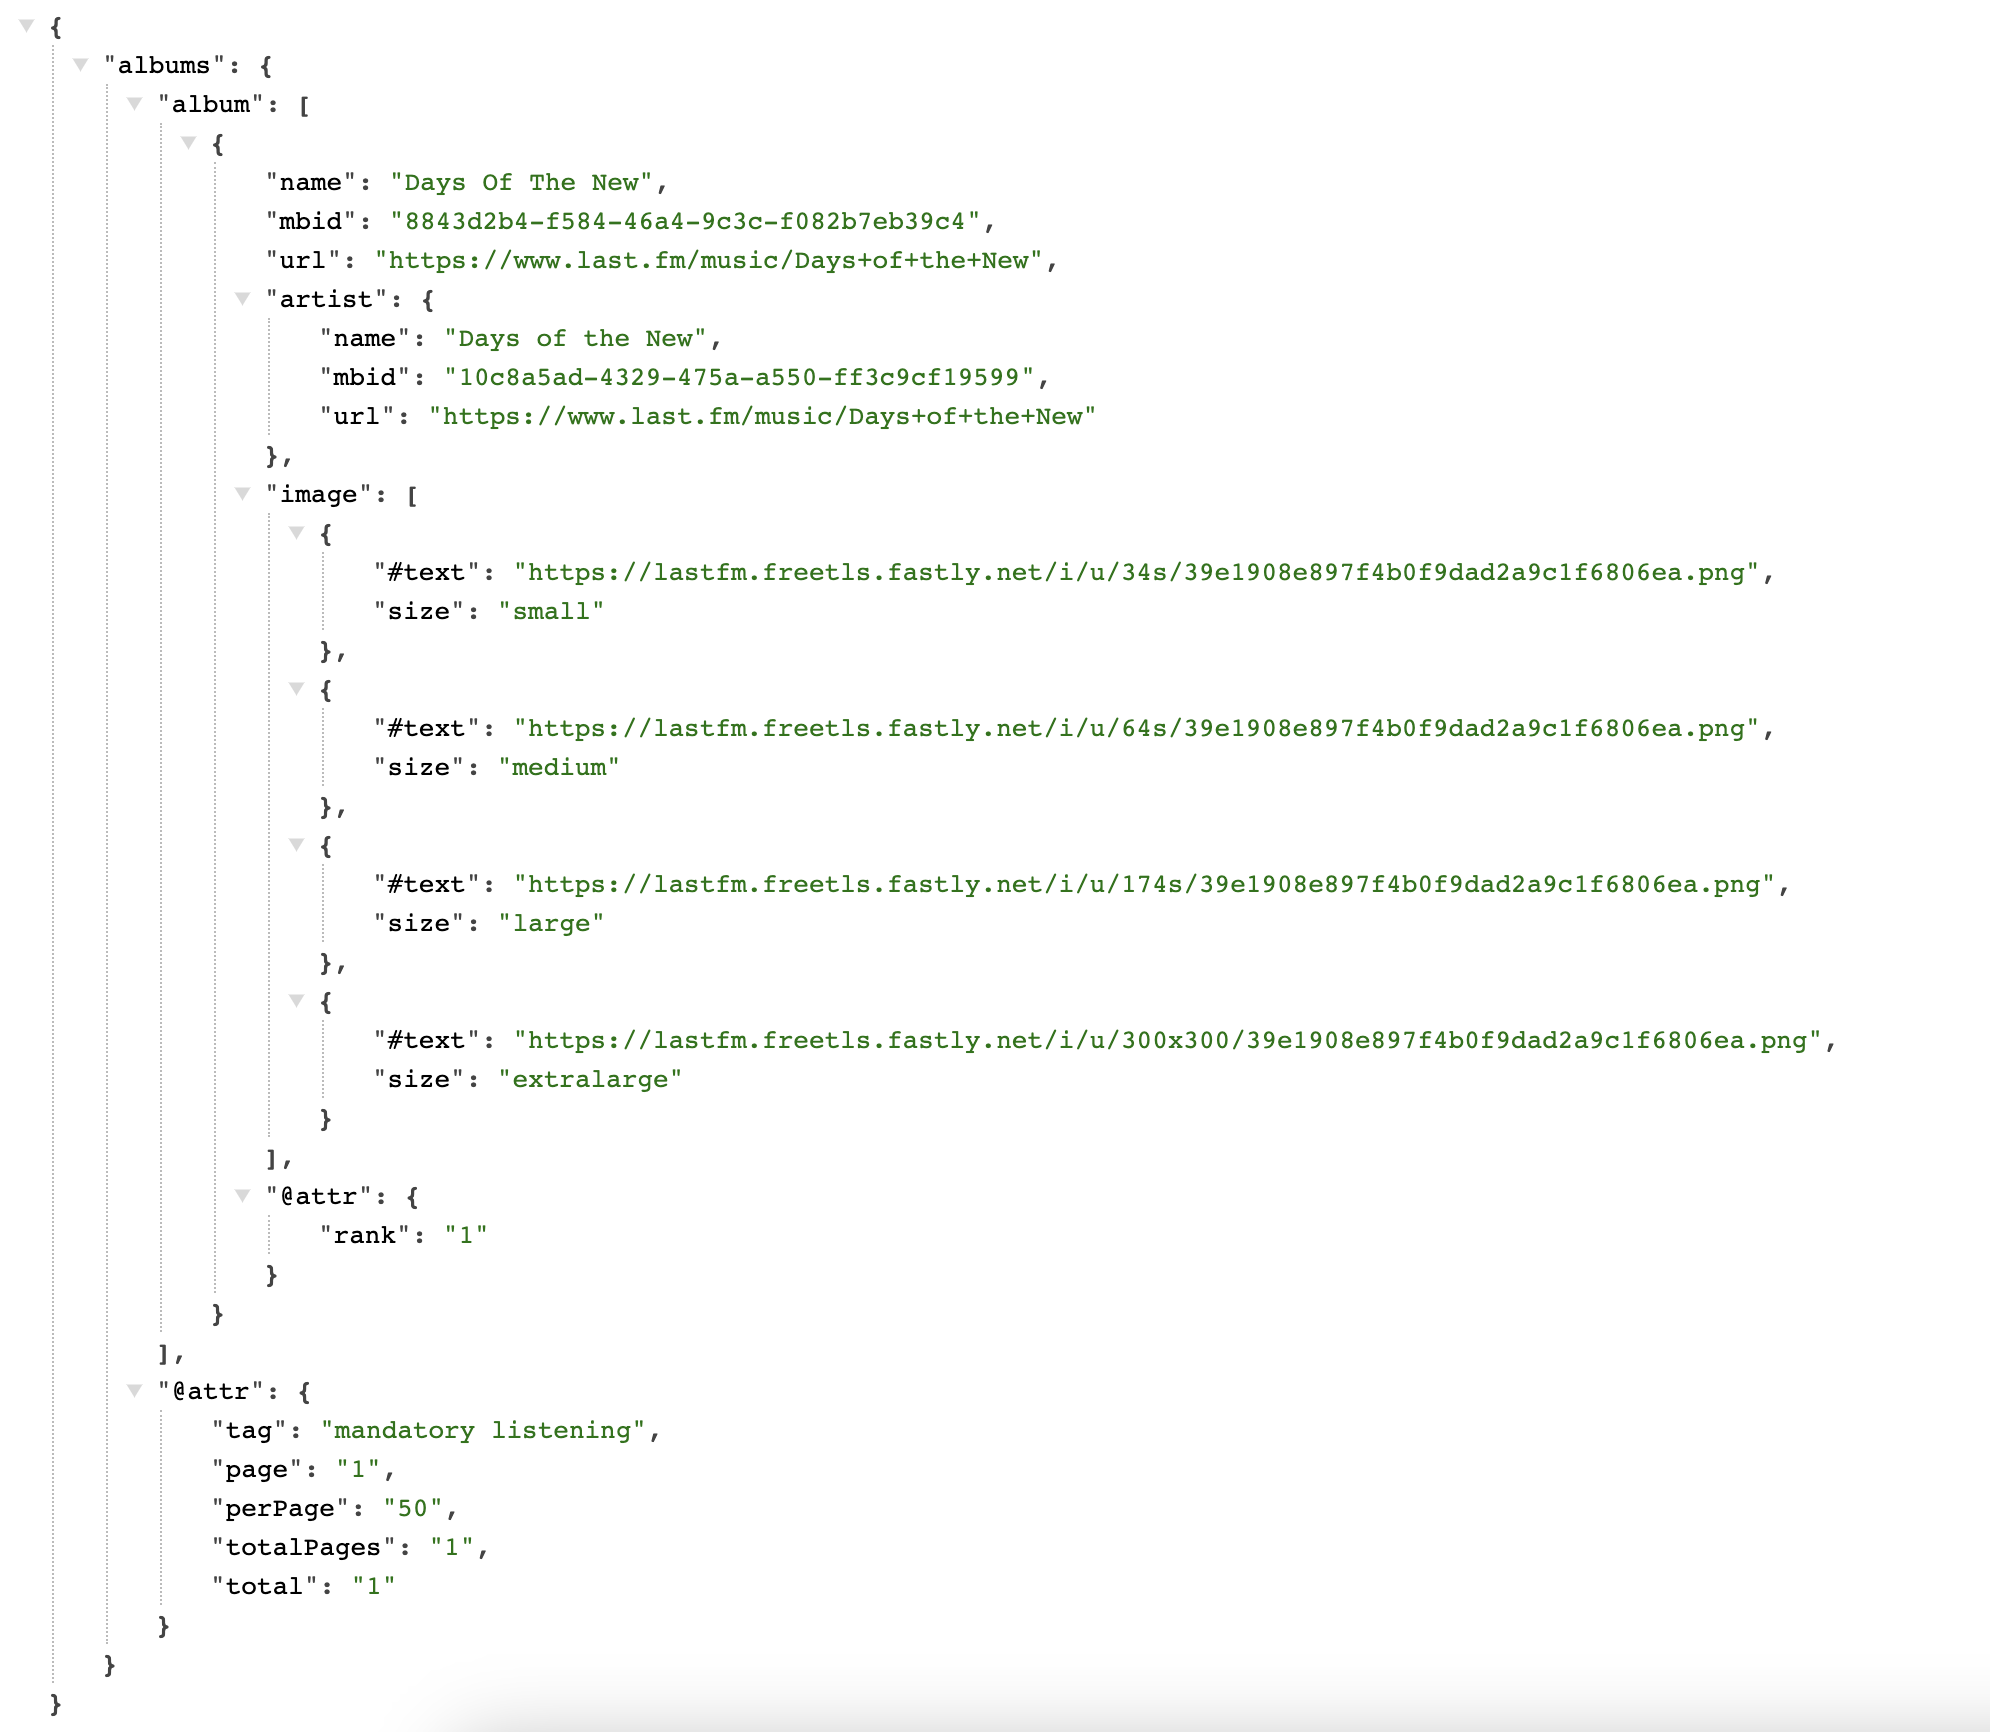
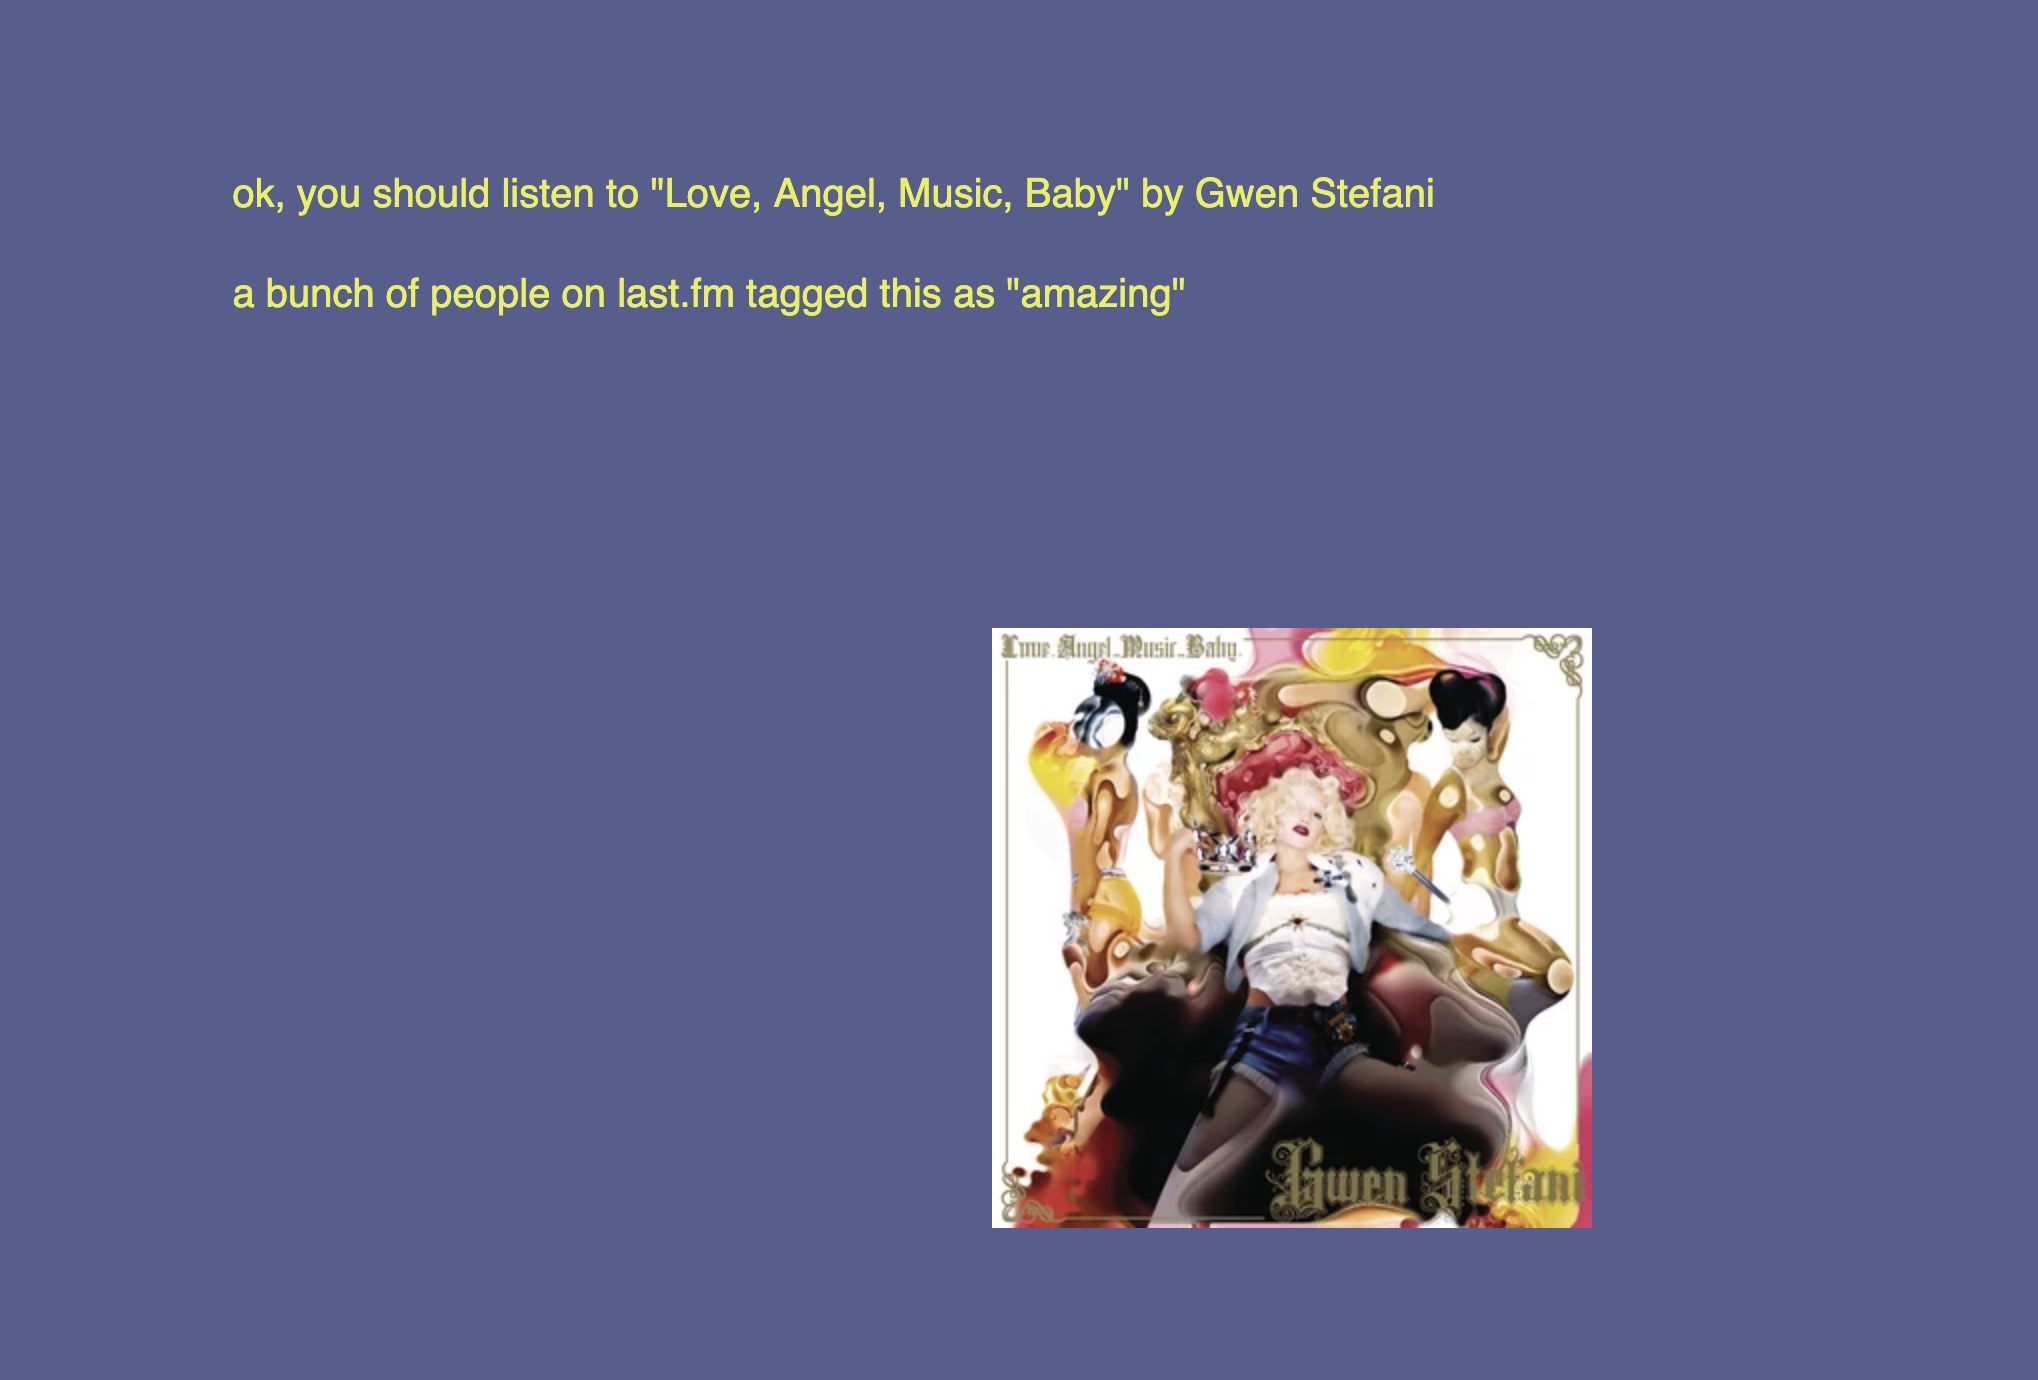
- Add the album image to the result page. I can’t figure out how to load this data - the “#text” in the image line confuses me.

- Fill out the narrative a little mor
- Add some sort of “loading” animation before the result page.
- Look into the weather API - I hit the call limit quickly & often while working on this over the weekend.
- Fix the text on the last page to remove the %20 in the spaces in the tags. I might need to just create a new array.
Here’s where I am now:
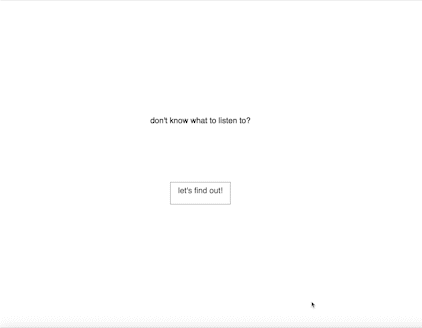
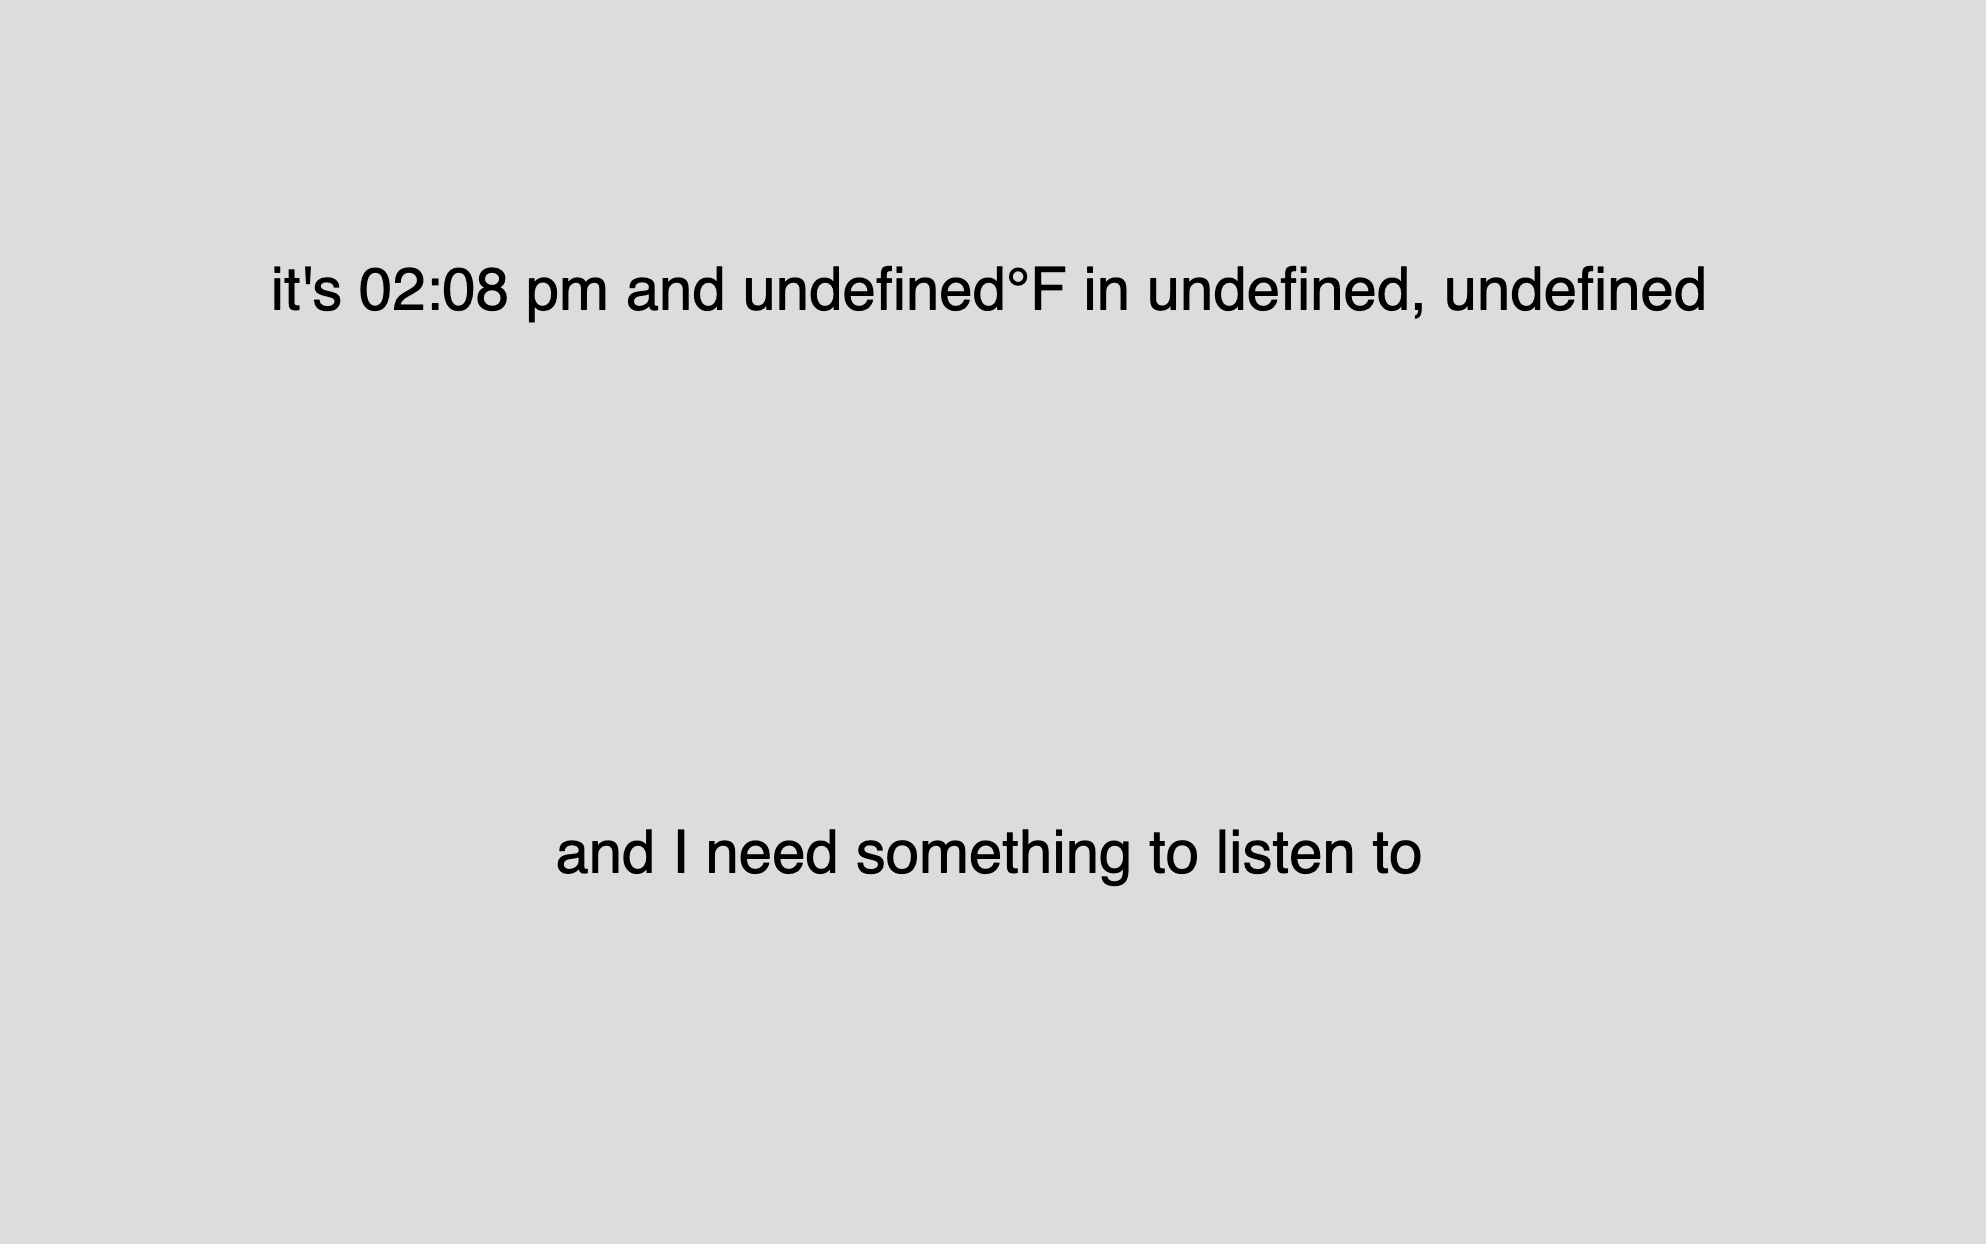
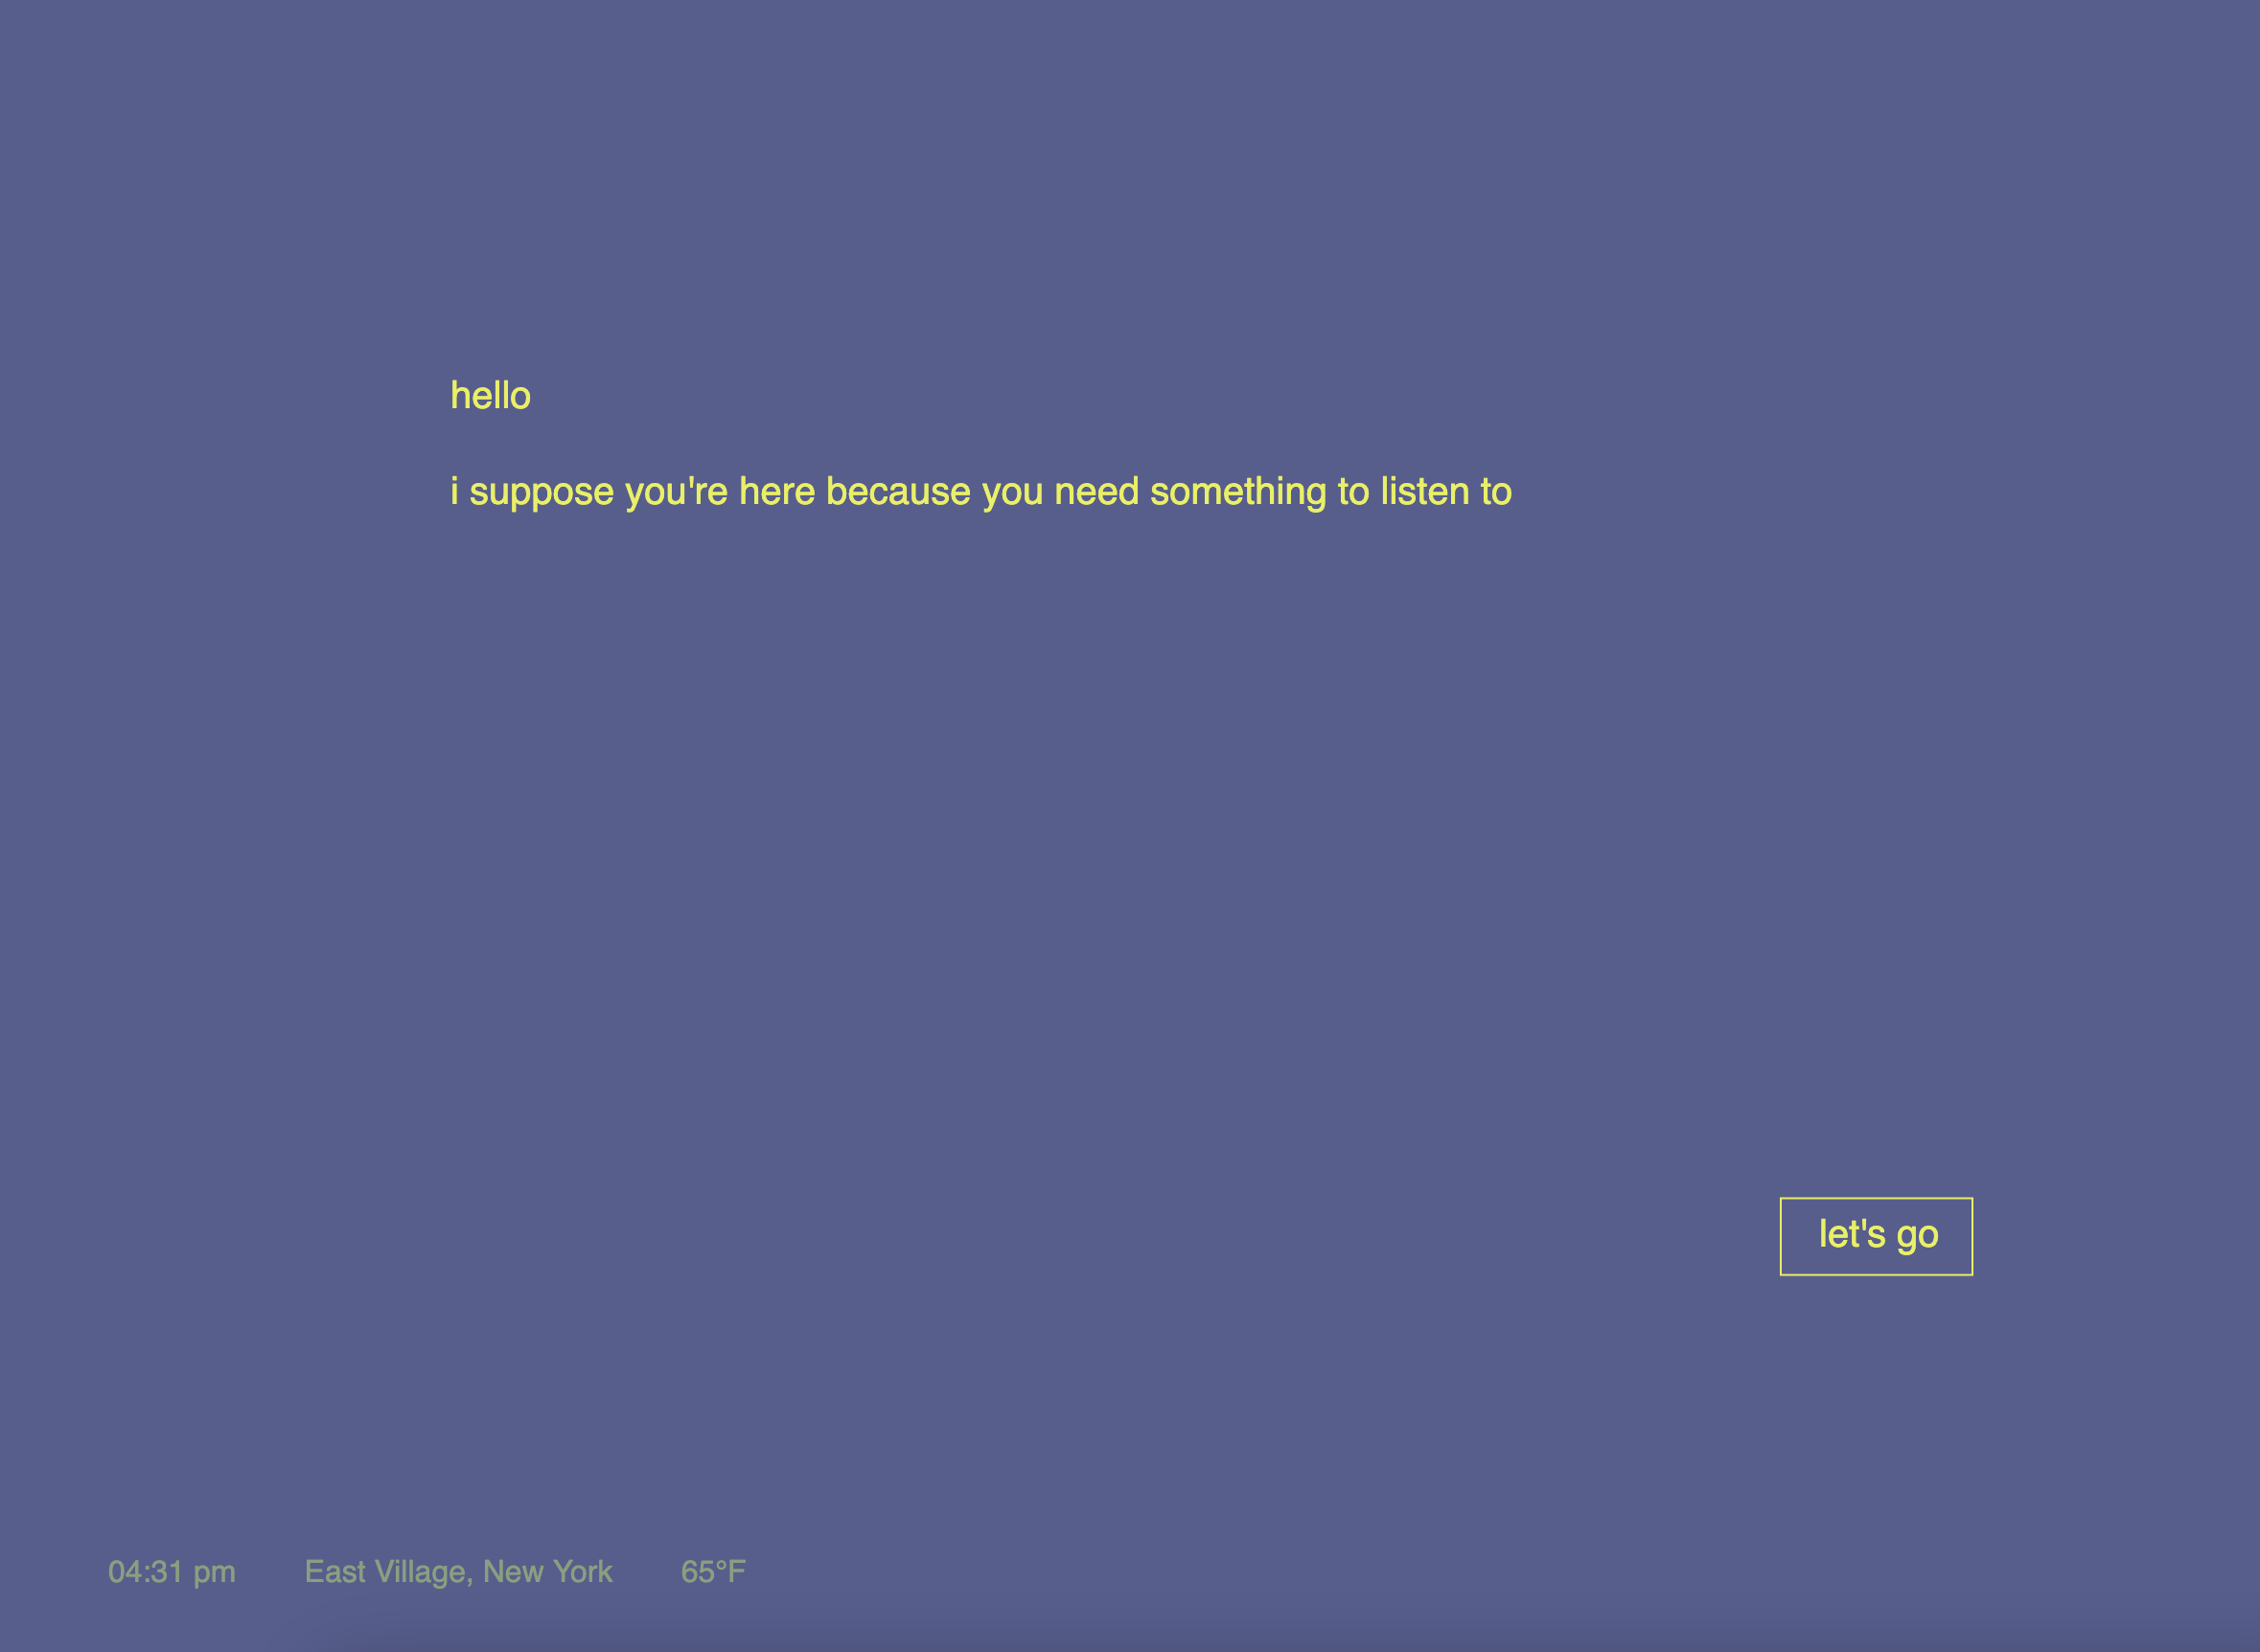
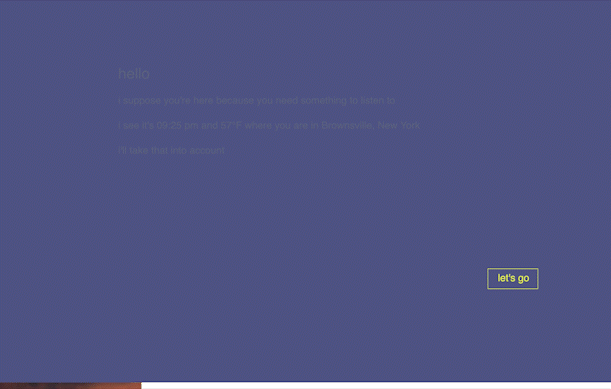
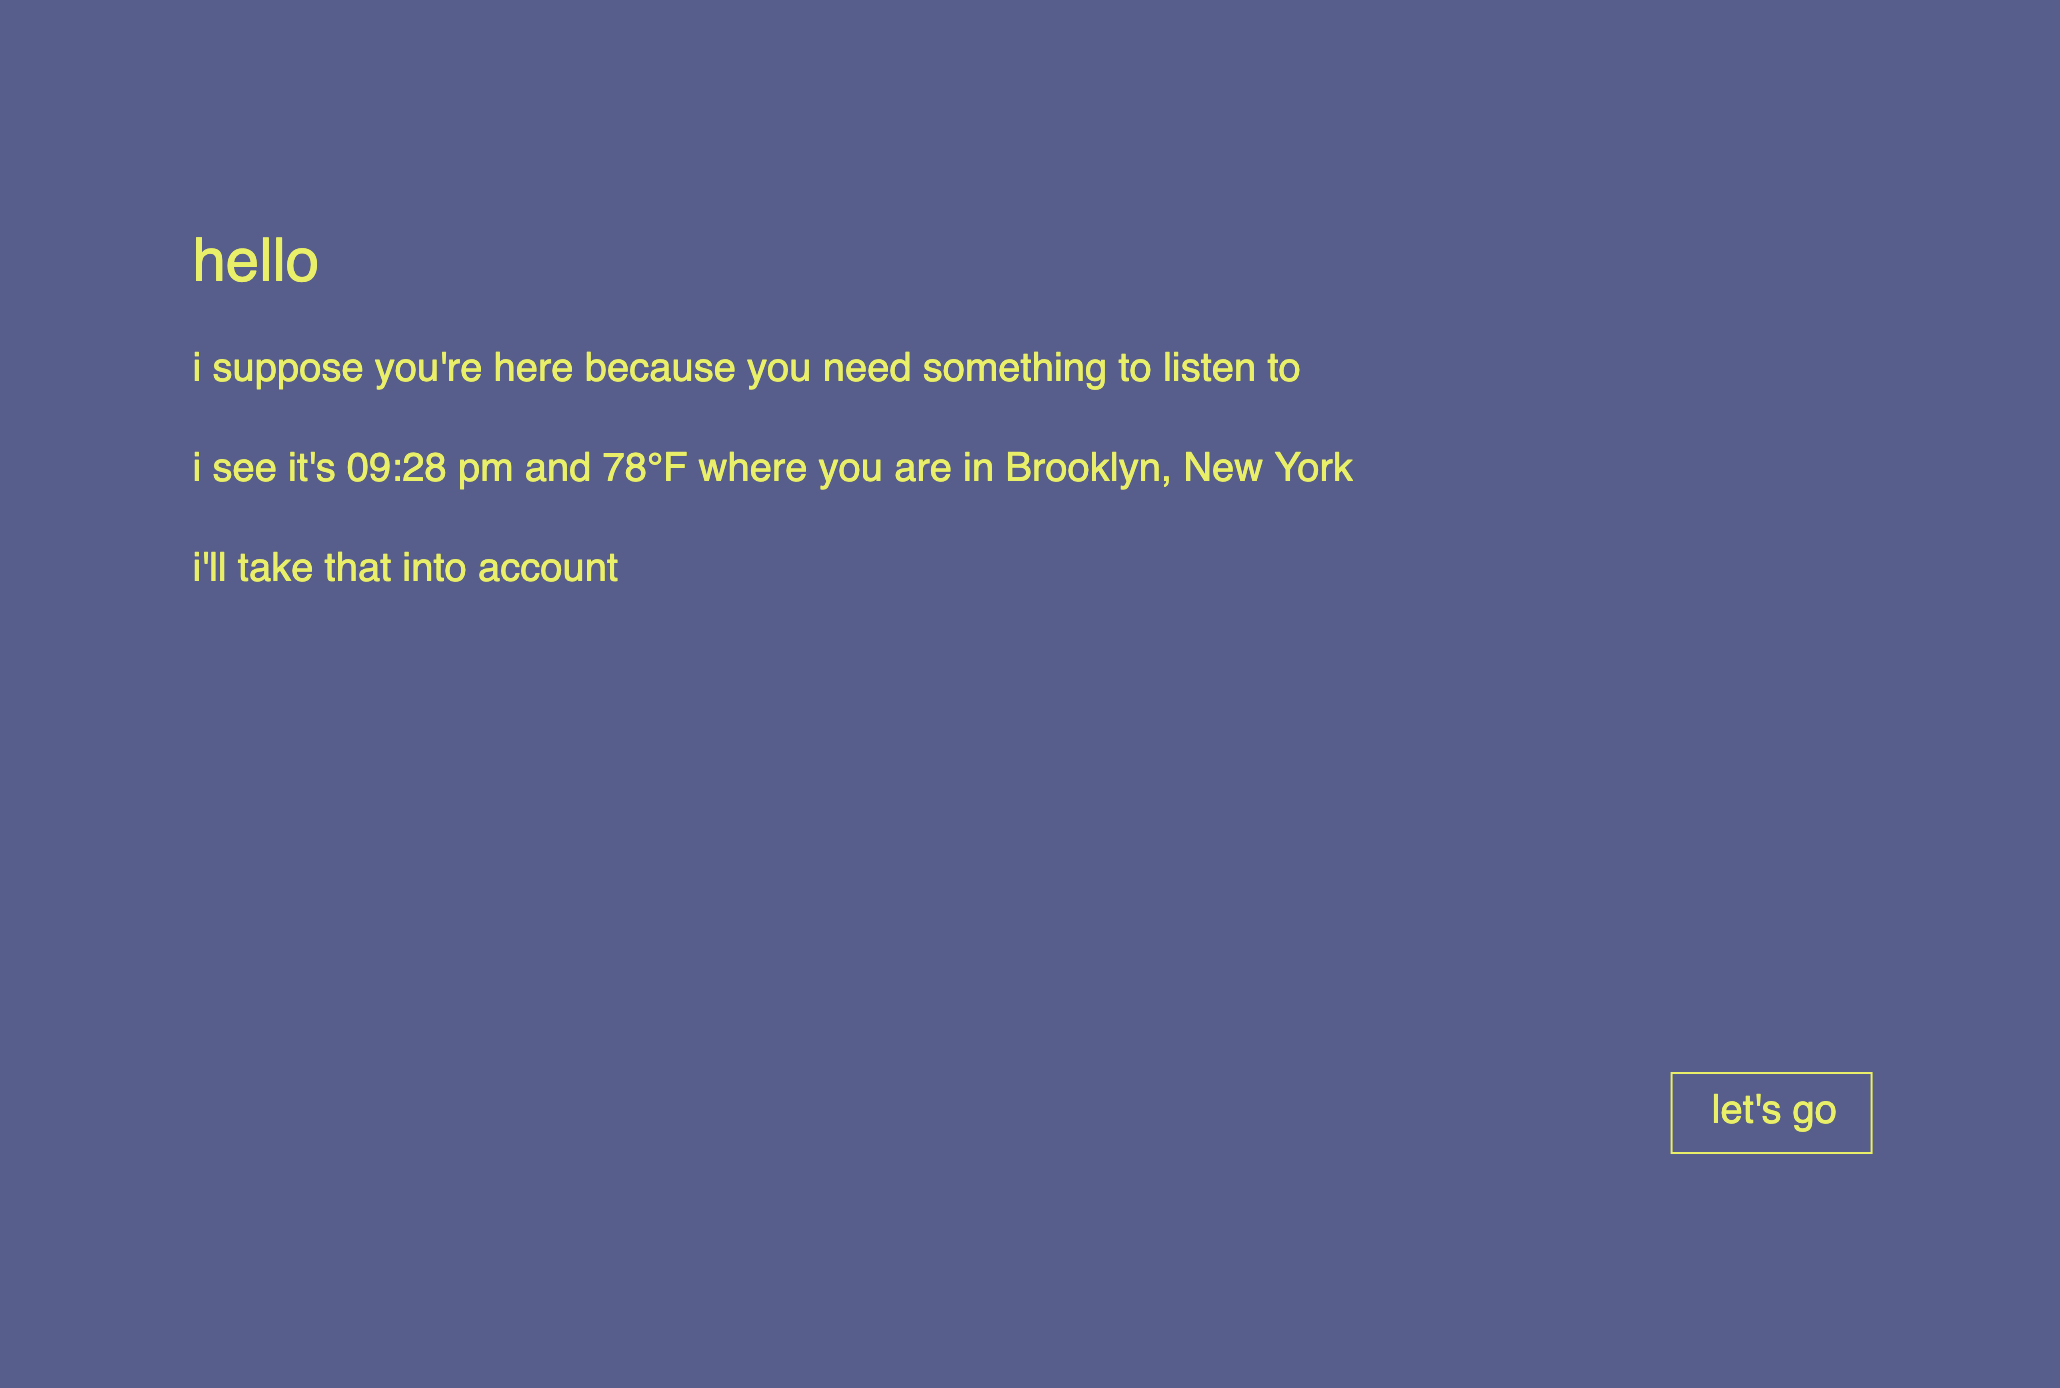
Start page, with time, location, and temperature data in the corner.
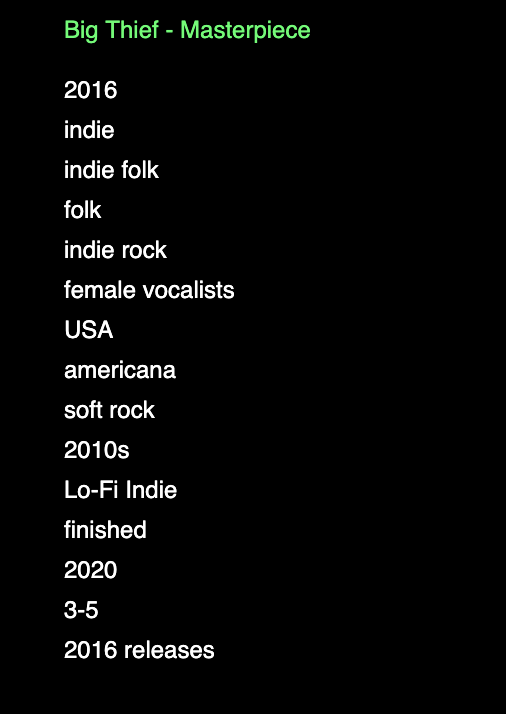
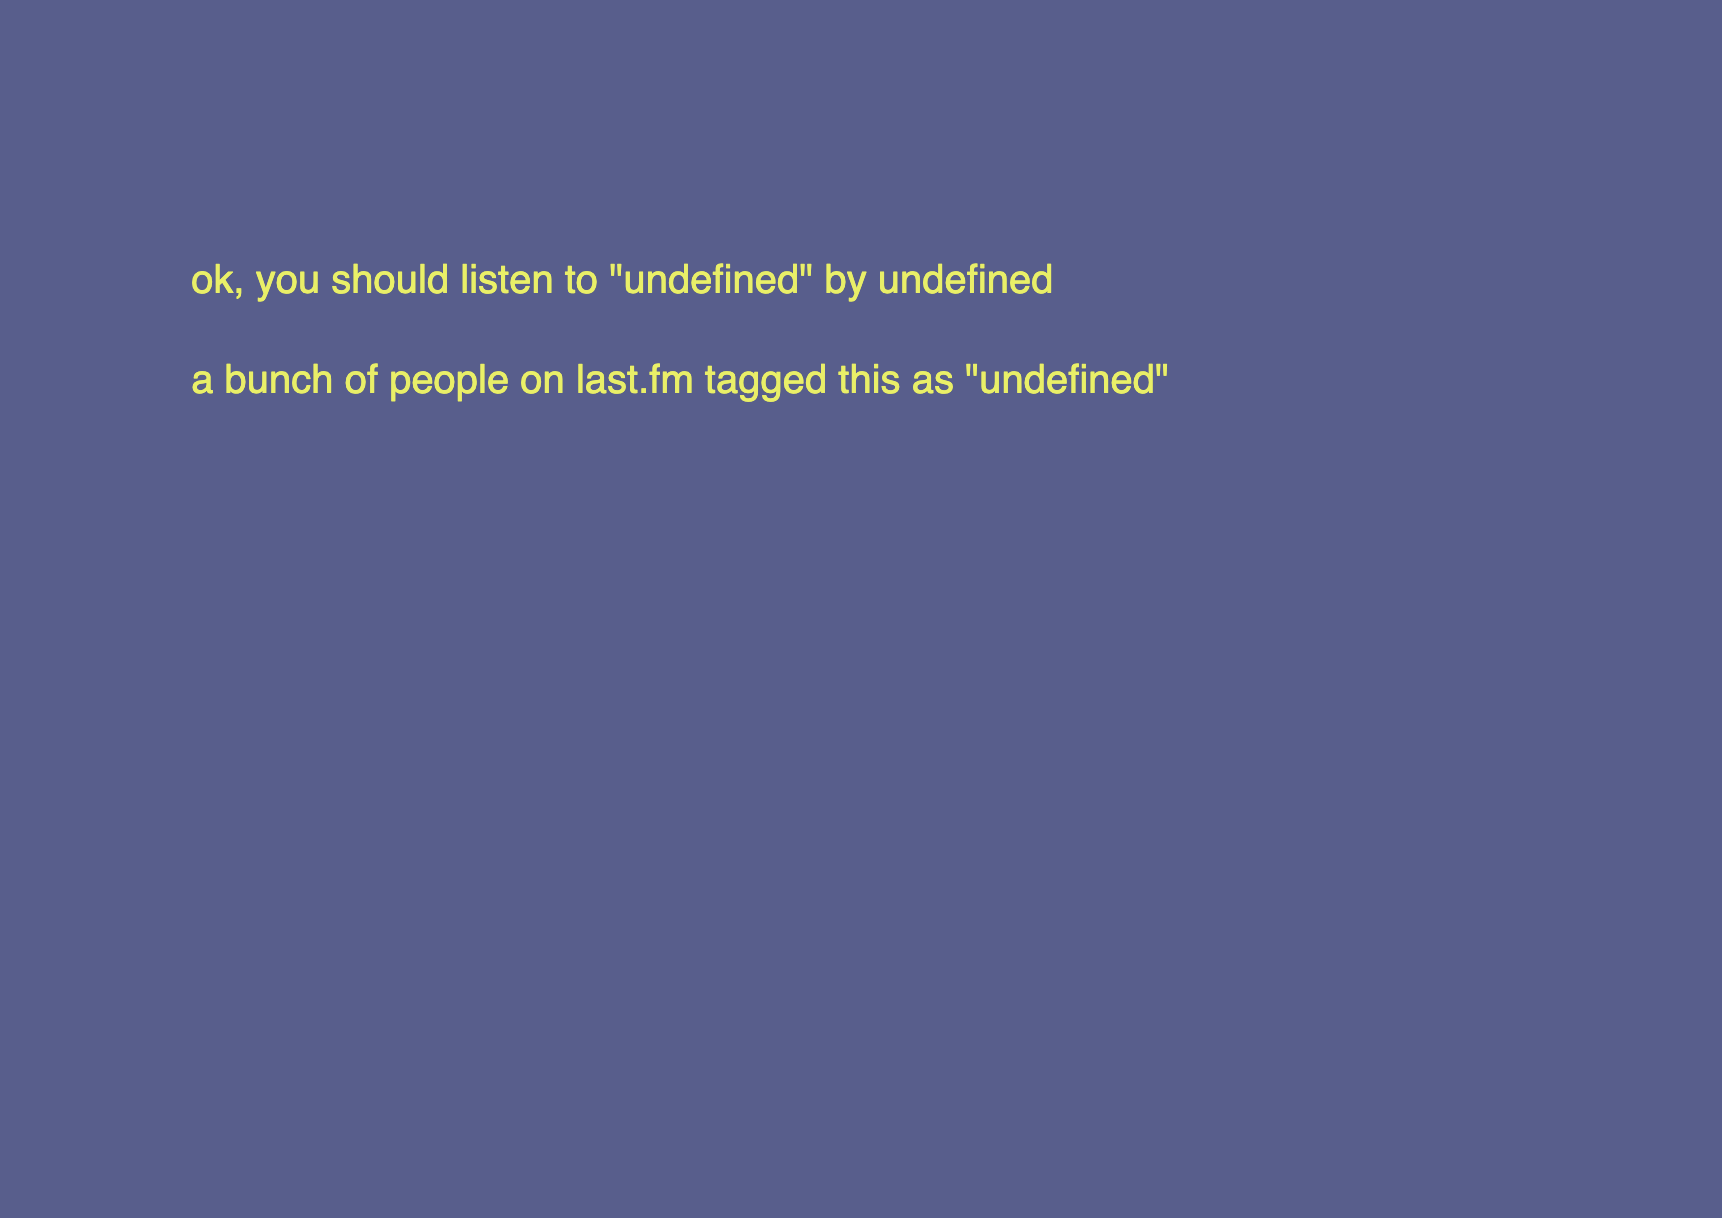
Some possible outcomes:


Some very human things I came across during the tag research:
There is a single album tagged with “pefect”. I was suprised by this until I realized that I had spelled perfect wrong, and so had this person.
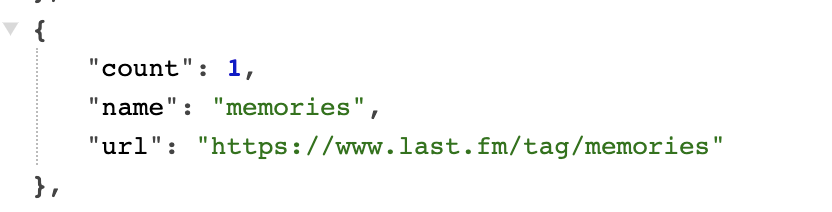
There is only one album tagged with “mandatory listening” and it’s the 1997 self-titled album by Days of the New.
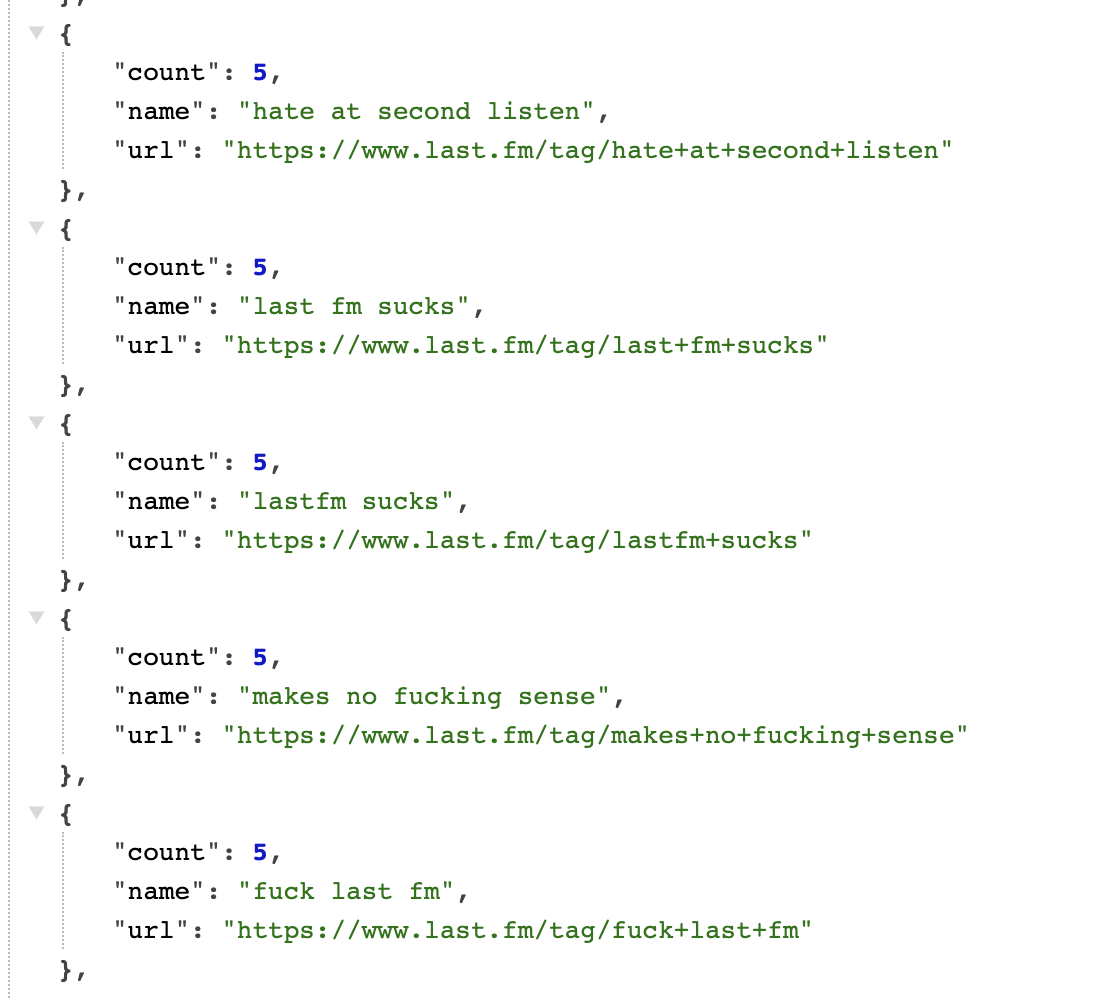
On the list of top tags for Taylor Swift’s folklore, I came across the tags “hate at second listen”, as well as many versions of “last fm sucks.”
On The Beatles’ Abbey Road, one person tagged it as just “memories, and another person tagged it as “childhood.” These both made me emotional.

WEEK 12: ADDING IMAGES & CLEANING UP CODE

2 WEEK PLAN: THINGS I NEED TO DO
2. Possibly switch to a different weather API. I keep hitting the limit for calls even though I’m well within what it says the limits are on the website. This one might work, but the documentation for starting out is a little confusing.
3. Figure out how to pull data from the second page of results. I want to do this so there is less of a chance of getting the same result within a few minutes of each other. Because the data is mapped to 0-50 and then rounded if it’s not a whole number, it’s possible for 2 different time & temp values to return the same value. I tried this last week but didn’t have much luck.
I’m going to try to finalize the algorithm & data stuff this week, and then work on the visual design & text next week.
Made a lot of progress this week. I solved the problem of hitting the weather/location API call limit by replacing the weather API with two new APIs - one that gets the latitude & longitude, and another that gets the weather data for that latitude & longitude.
The new issue though, was that the geolocation data takes forever (about 5 seconds) to load. Everything relies on the location data, so I needed to create a chain of functions that called each other in succession, to avoid this:

I used the fetch( ) function to solve this problem, which required a lot of trial and error. This is the basic order of operations I ended up with:
1. Log the hour + minute from the local time when the page is opened.
2. Run the location API.
3. Only when that has returns a result, load the weather API with the latitude & longitude from the location API.
4. Log the temperature
5. Run the numbers & get the album rec.
Once I got that working correctly, I made a start page + loading page, mostly to kill time before all the data was loaded. I then decided to make my life harder by making the text look like it was being written in real time by a typewriter. I think it was worth it.