

What Jacket Should I Wear Today?
Link to sketch


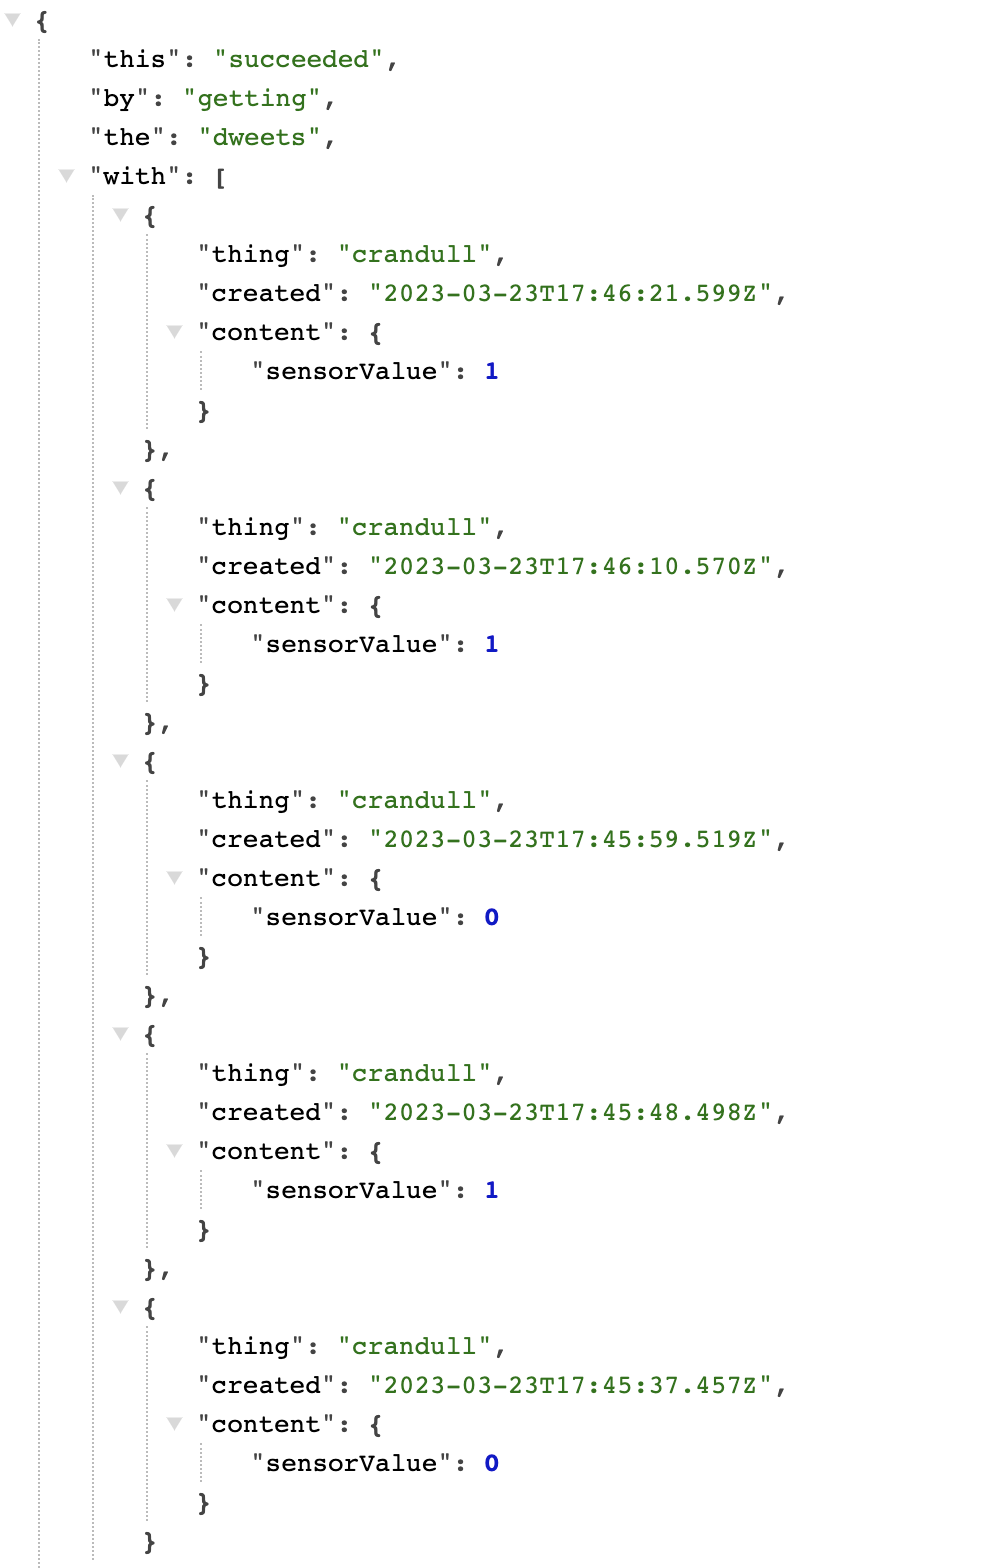
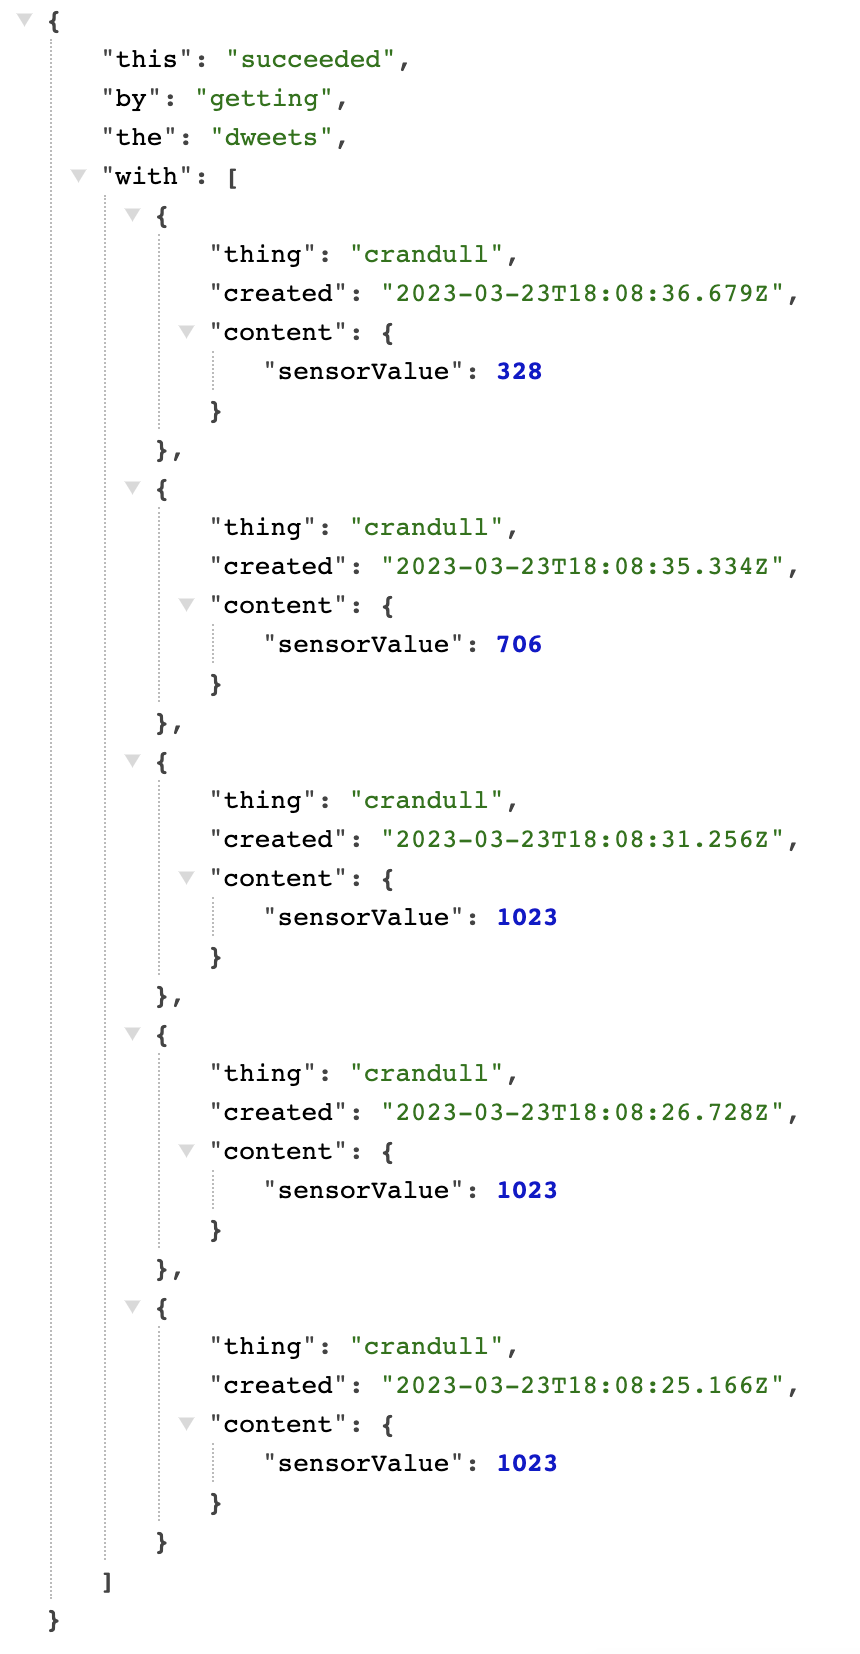
Before I got into creating my application, I tried to recreate what we did in class, with sending potentiometer values to dweet. I had to get a new Arduino (found out in class that my antenna was broken), so I spent some time setting it up and got into it.
Dweet is a cool concept and I can see how it’s helpful, but it’s a little confusing to me. The terminology they use (thing ? dweet ?) and the syntax they use is totally new to me and not super intuitive. I started getting weird potentiometer values (left) until Priyanka (genius) informed me I had my power wire in the wrong pin. Once I fixed that, I started getting accurate data (right).
Pretty quickly though, I ran into this problem. This was annoying.

For my application, I wanted to make something that would recommend what jacket for me to wear based on real-time weather data. I feel like I go through this problem every morning - where I have no idea what to wear and it takes me forever to figure it out.
I created a p5 sketch, and the first thing I did was pull the temperature data from the air quality API, which wasn’t too difficult when I followed along with this Coding Train video. I plugged in the latitude & longitude of a park near my apartment to get the following data:

In my p5 sketch, I used the following code to pull the “tp” data specifically. I then converted it to fahrenheit manually, because I couldn’t find any info in the documentation about how to change the units.

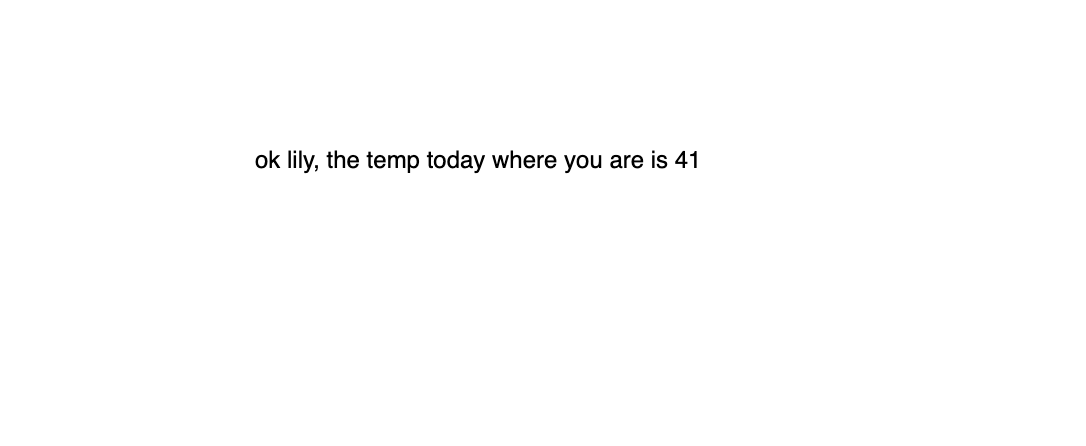
Then I used the code on the left to get the output on the right.

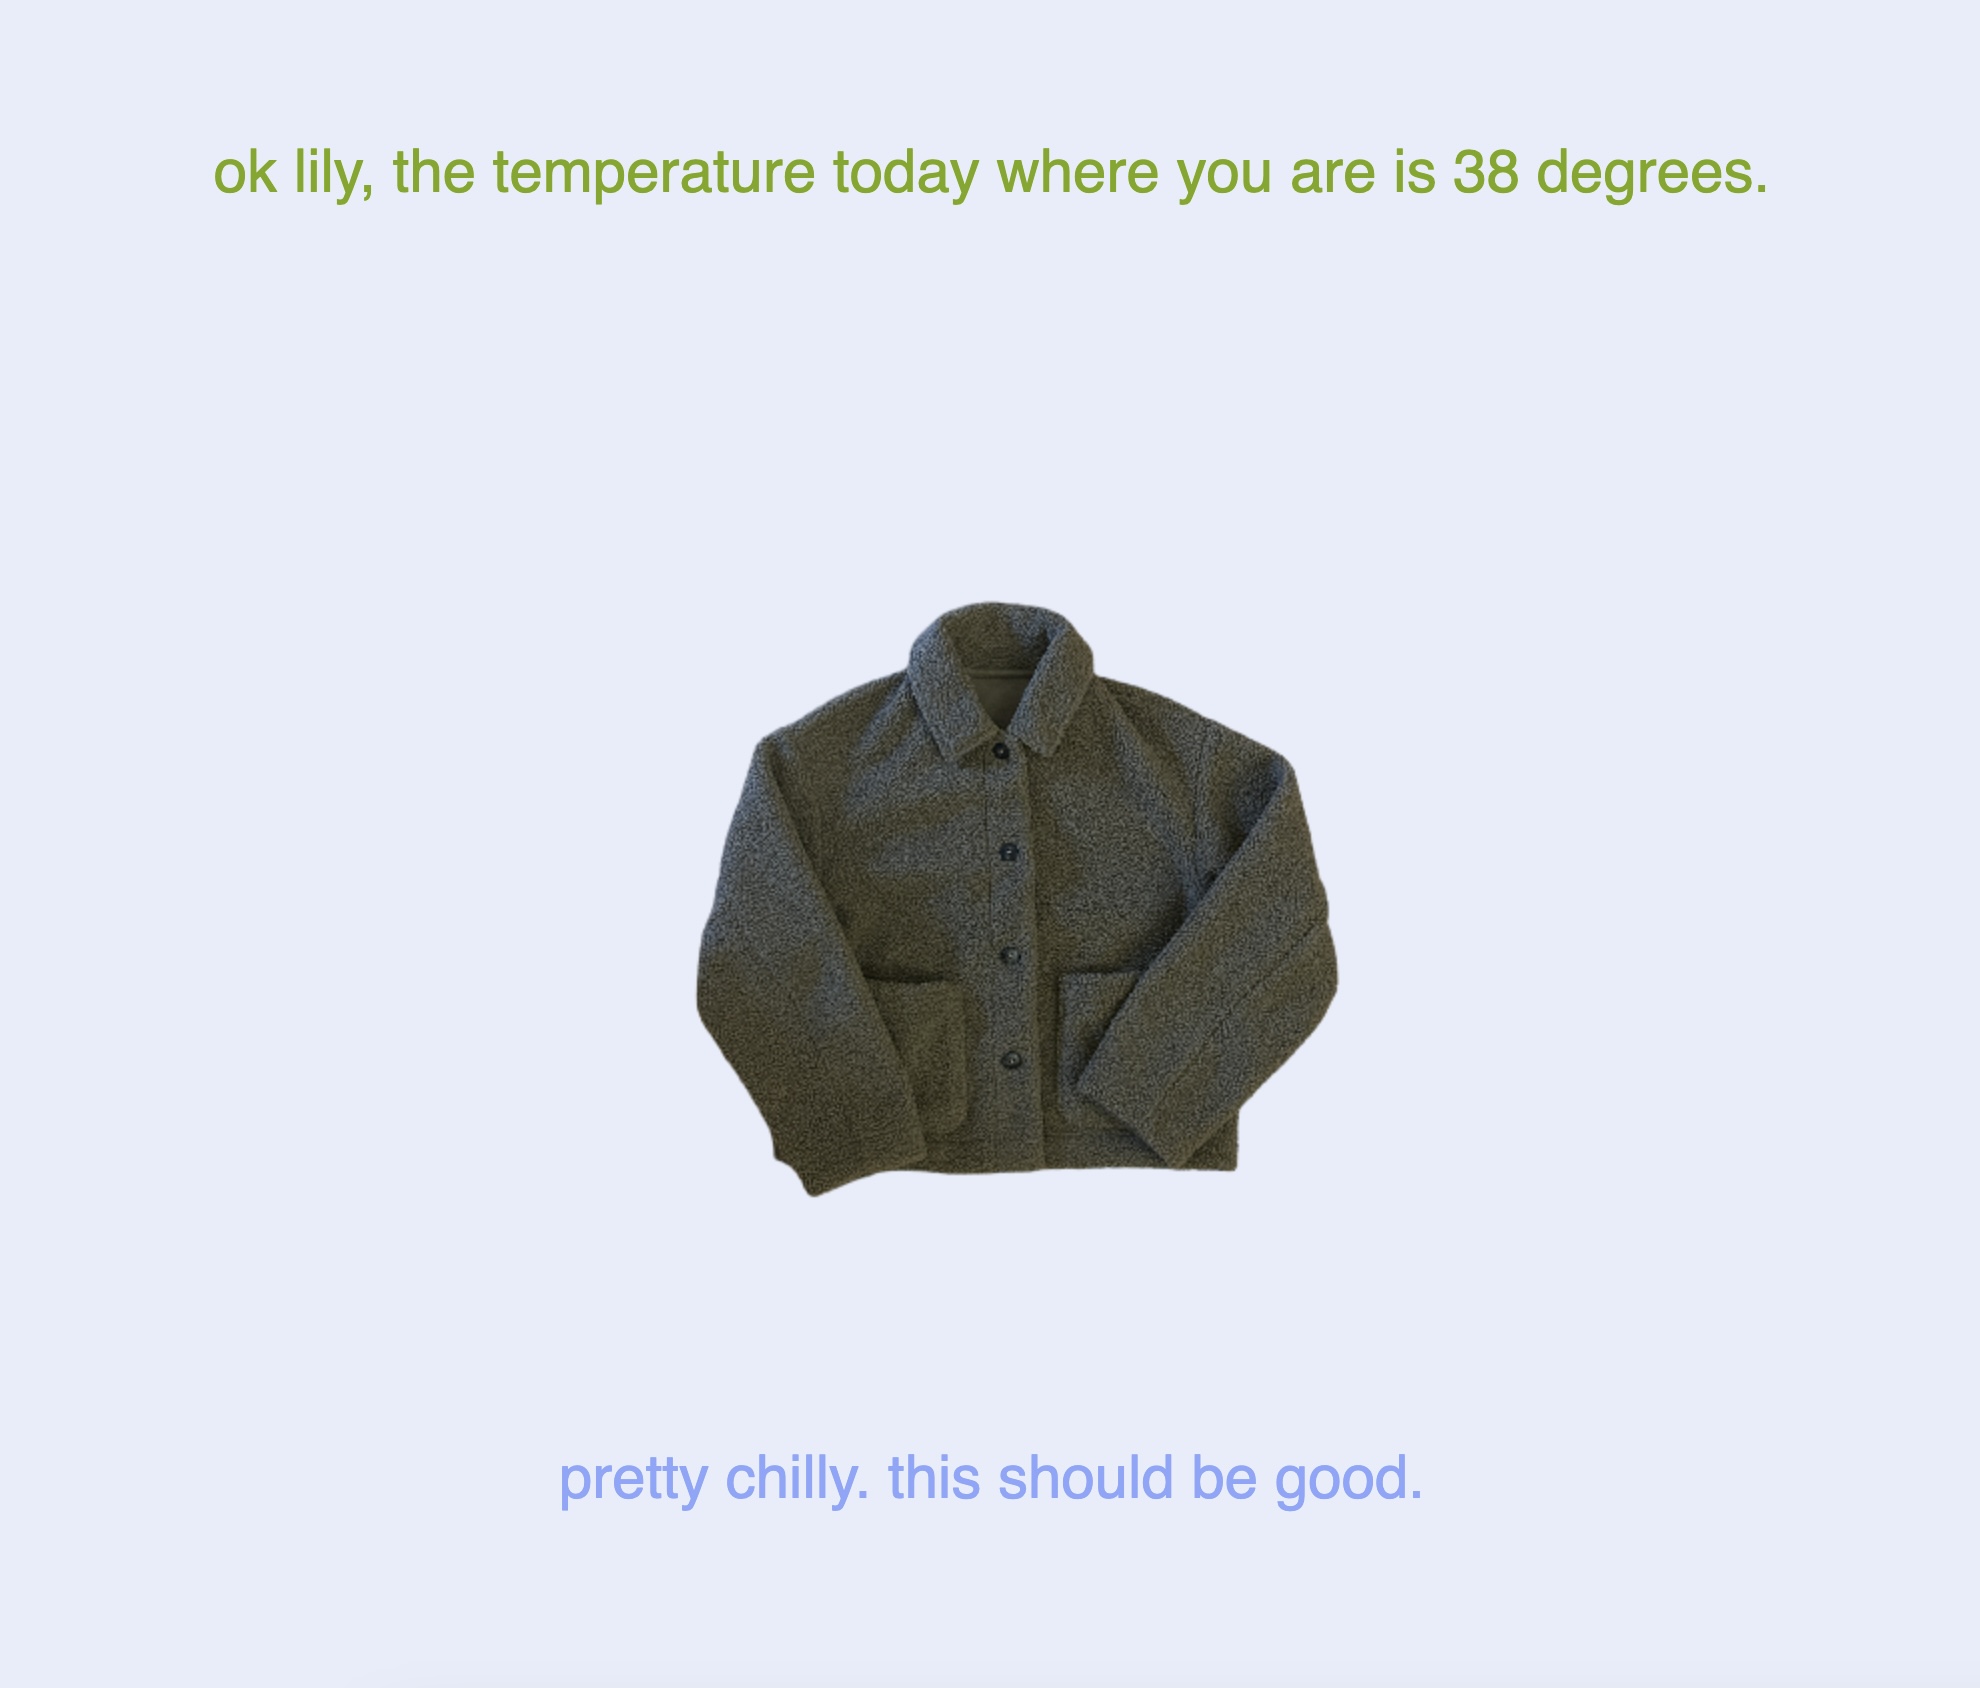
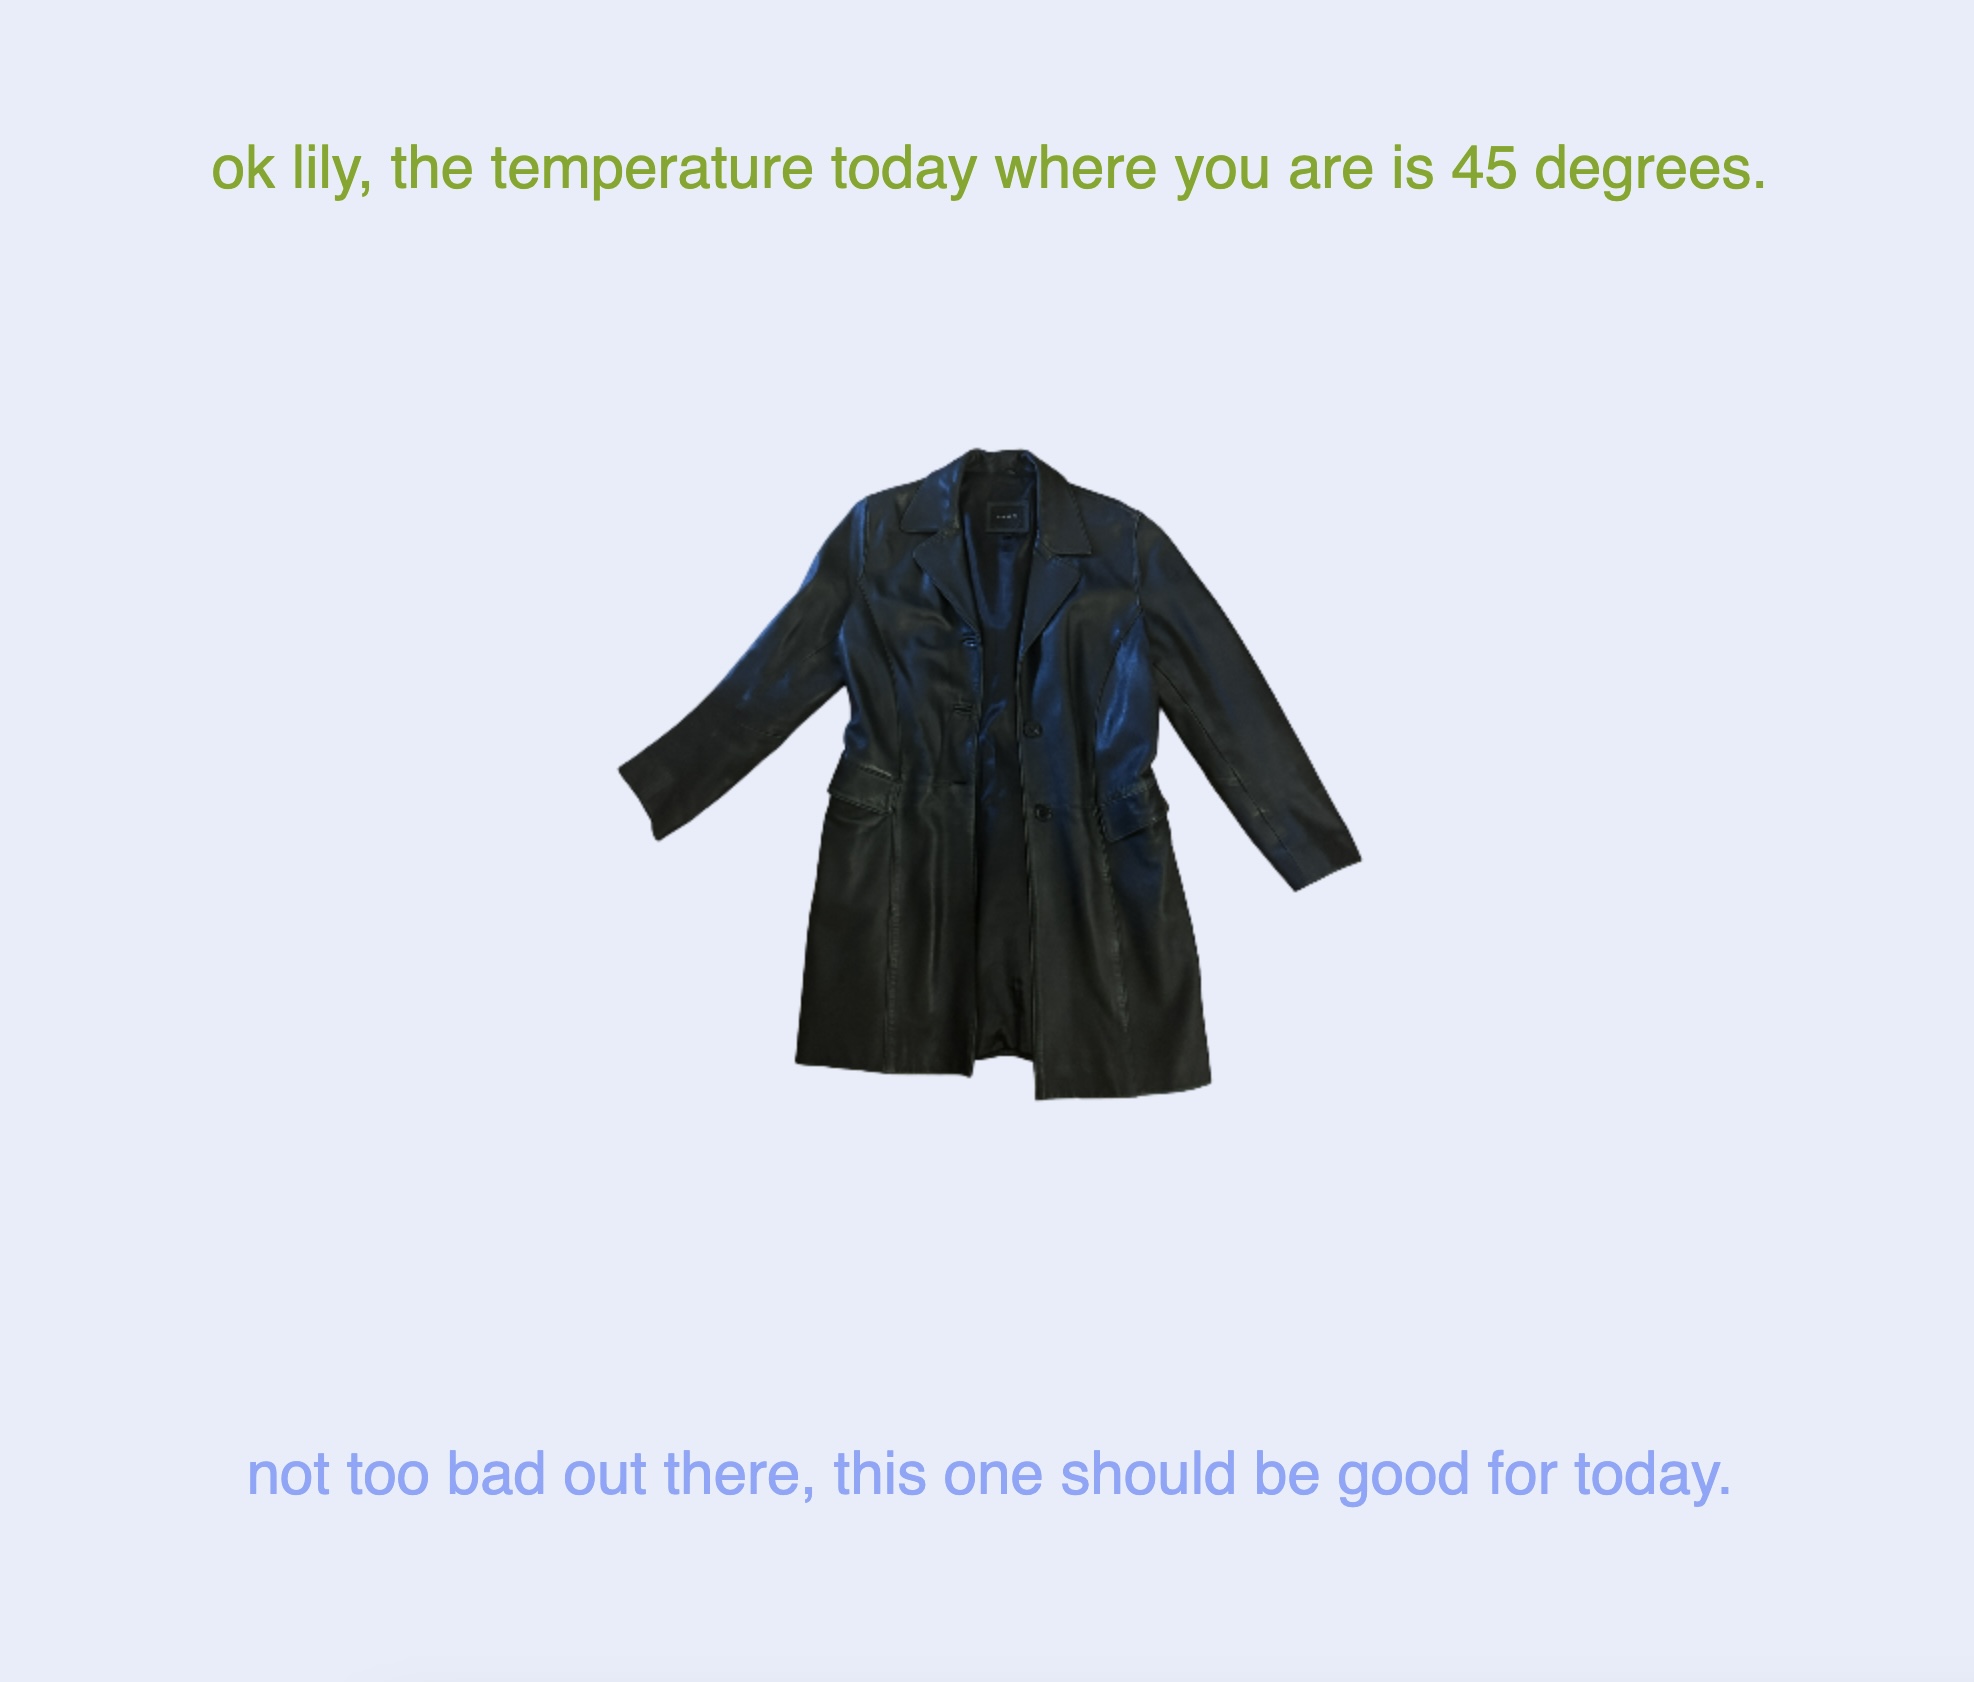
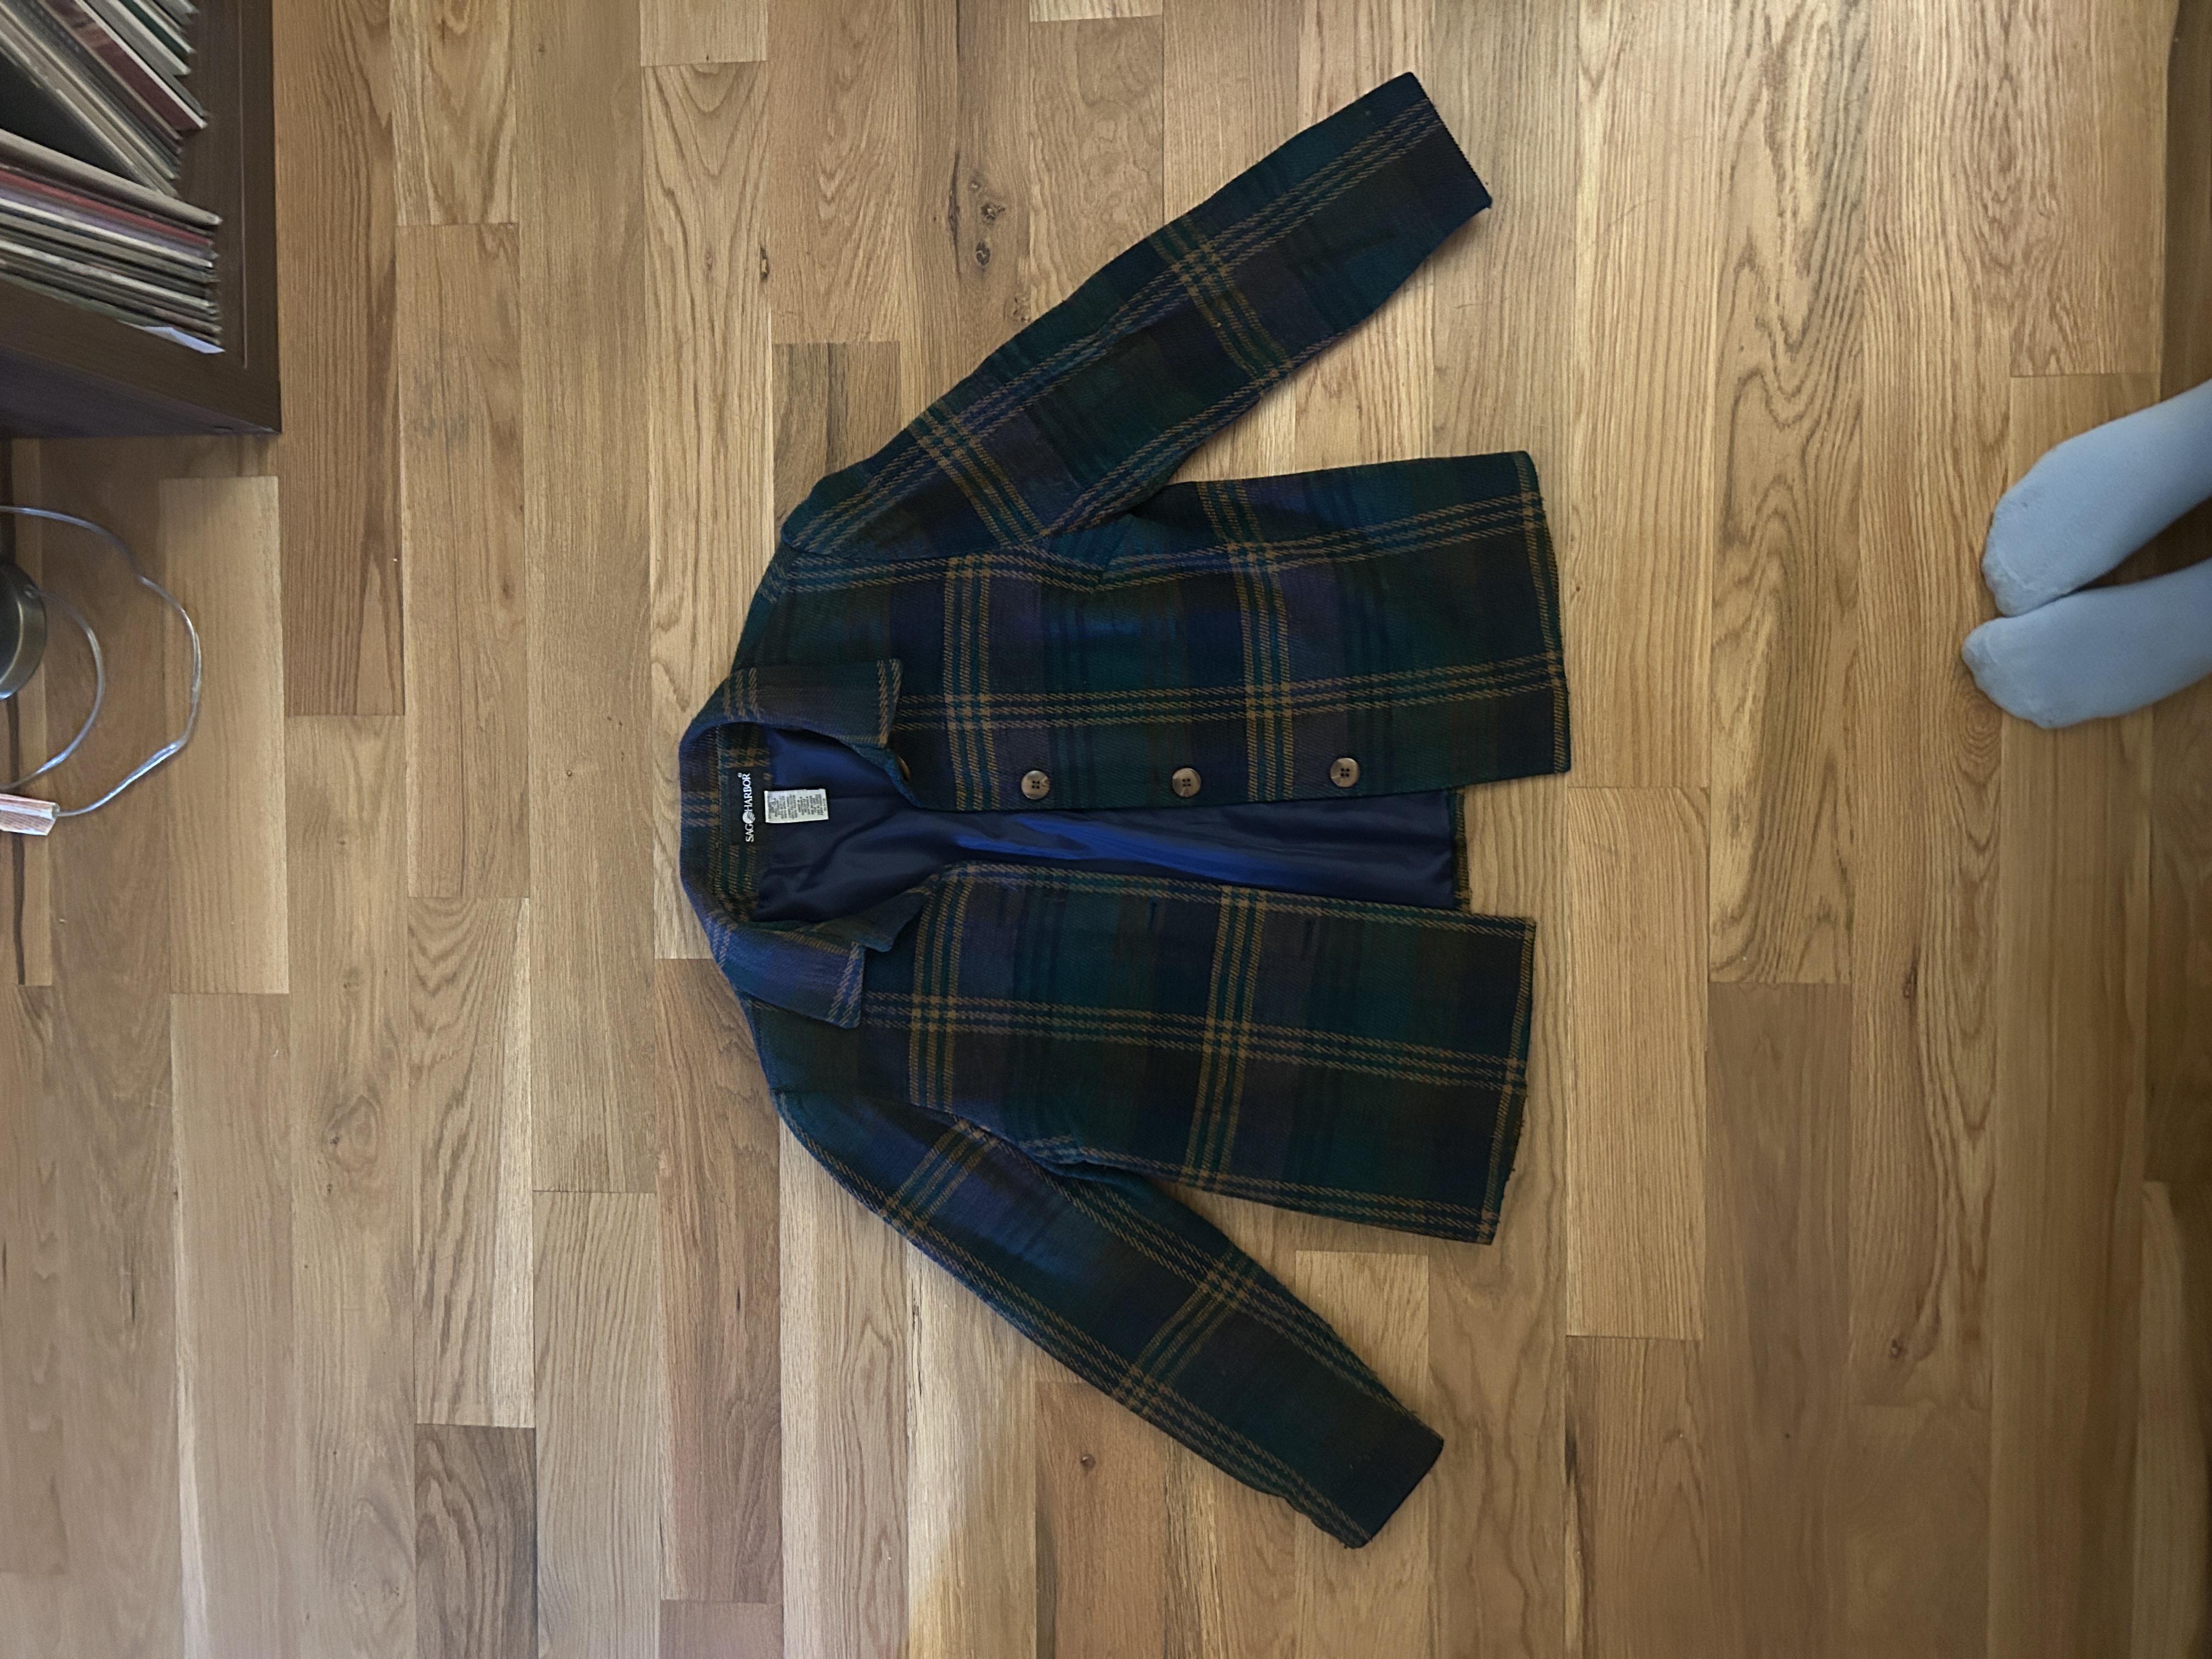
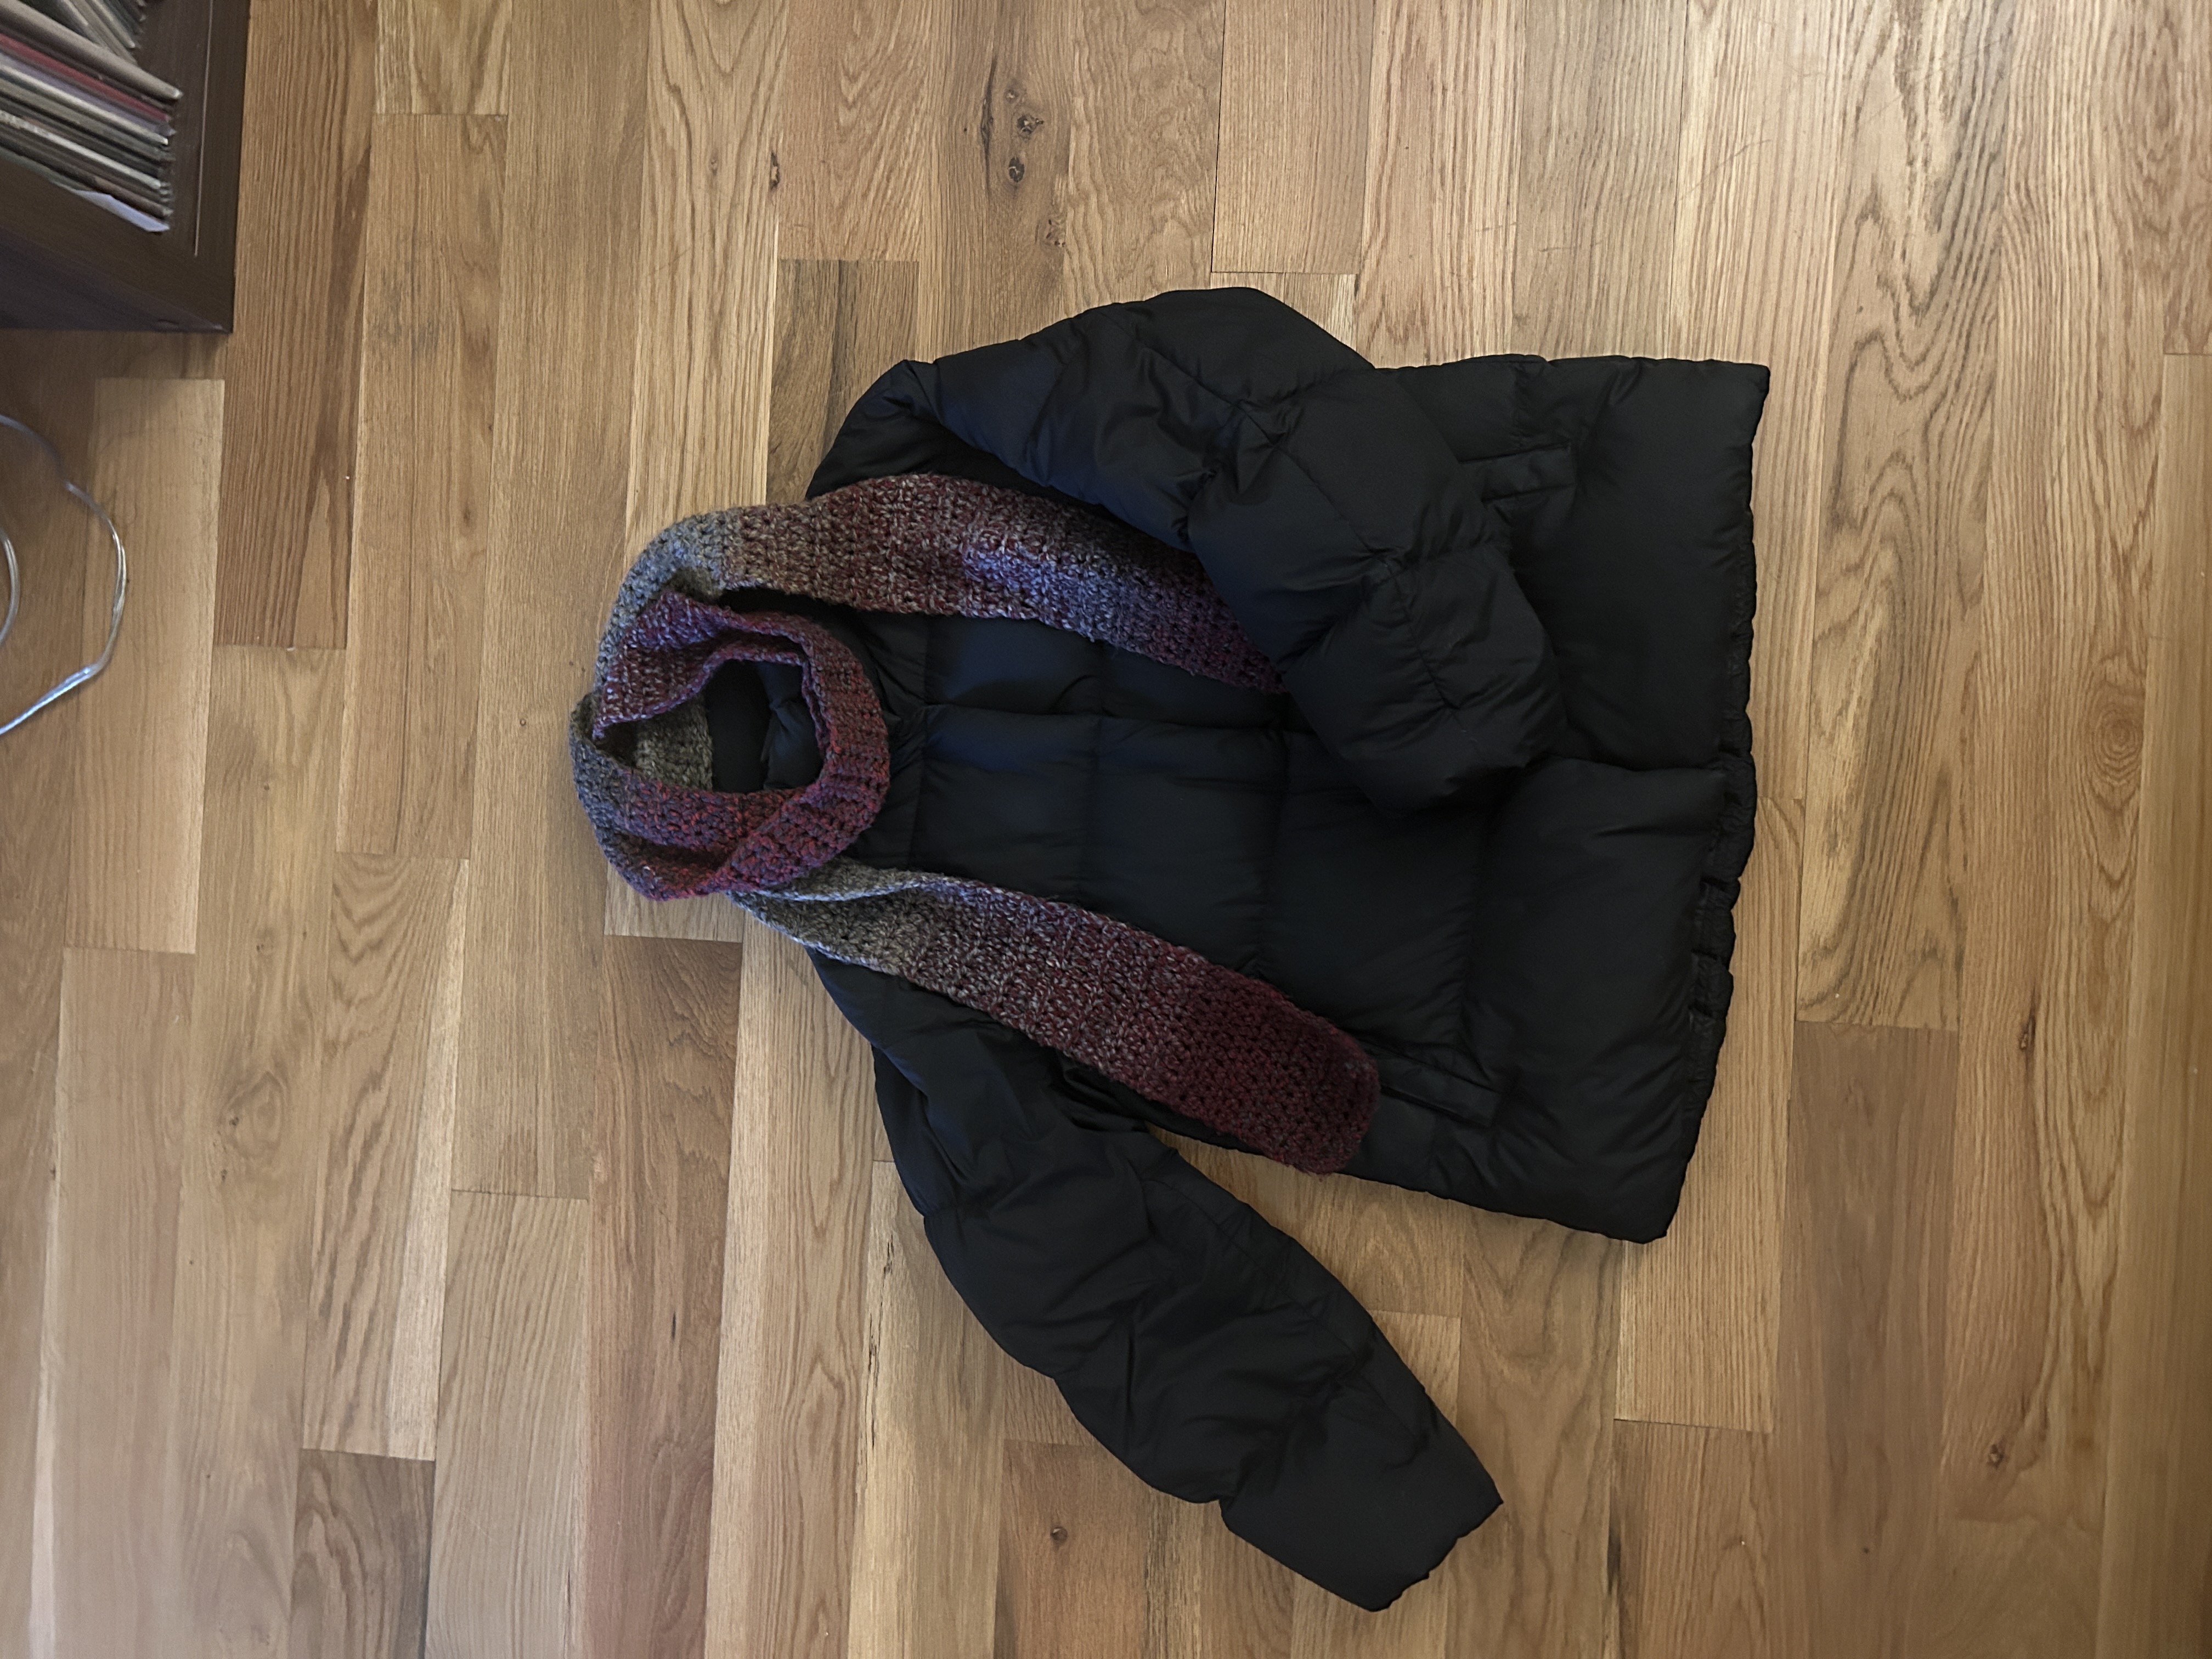
From there, I wrote down a list of temperature ranges that would define my logic for which jacket I would recommend:

Then, I took photos of my jackets laid on the floor of my apartment to coincide with each range.
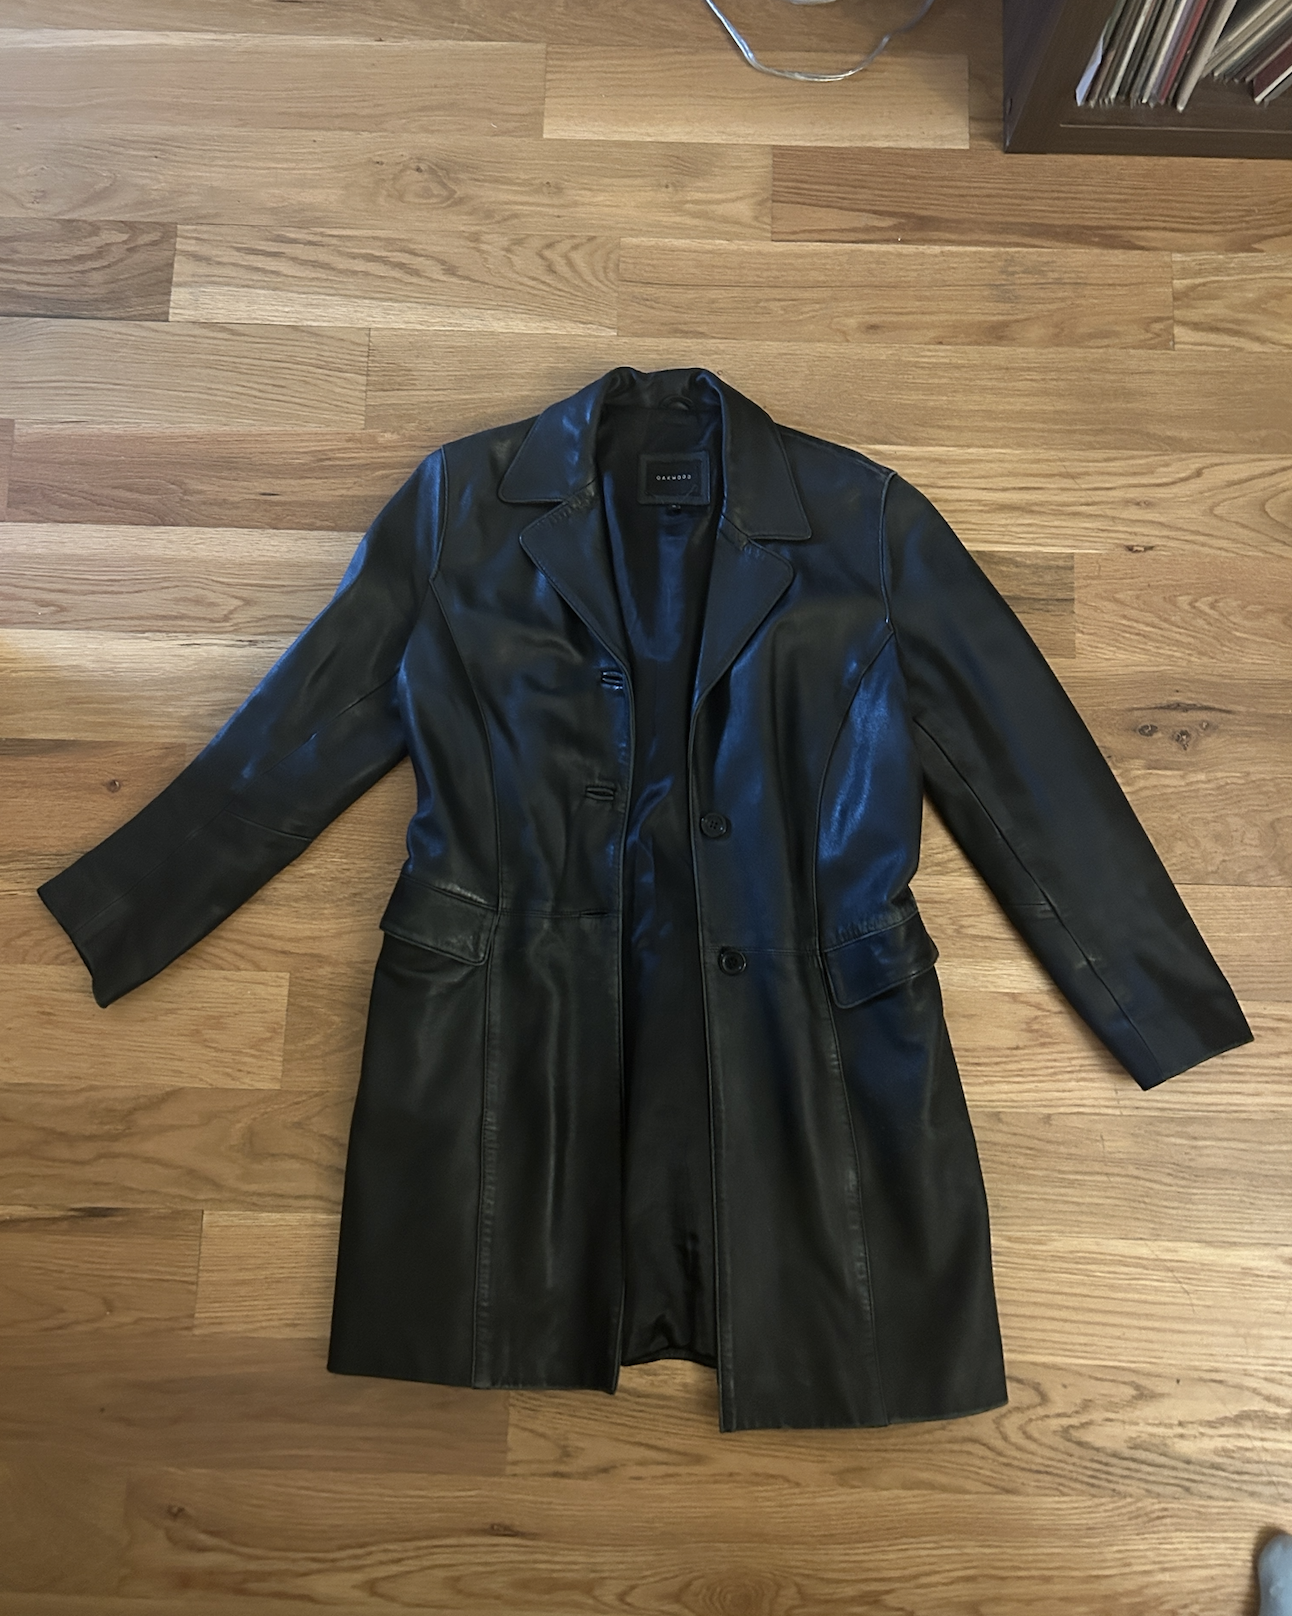
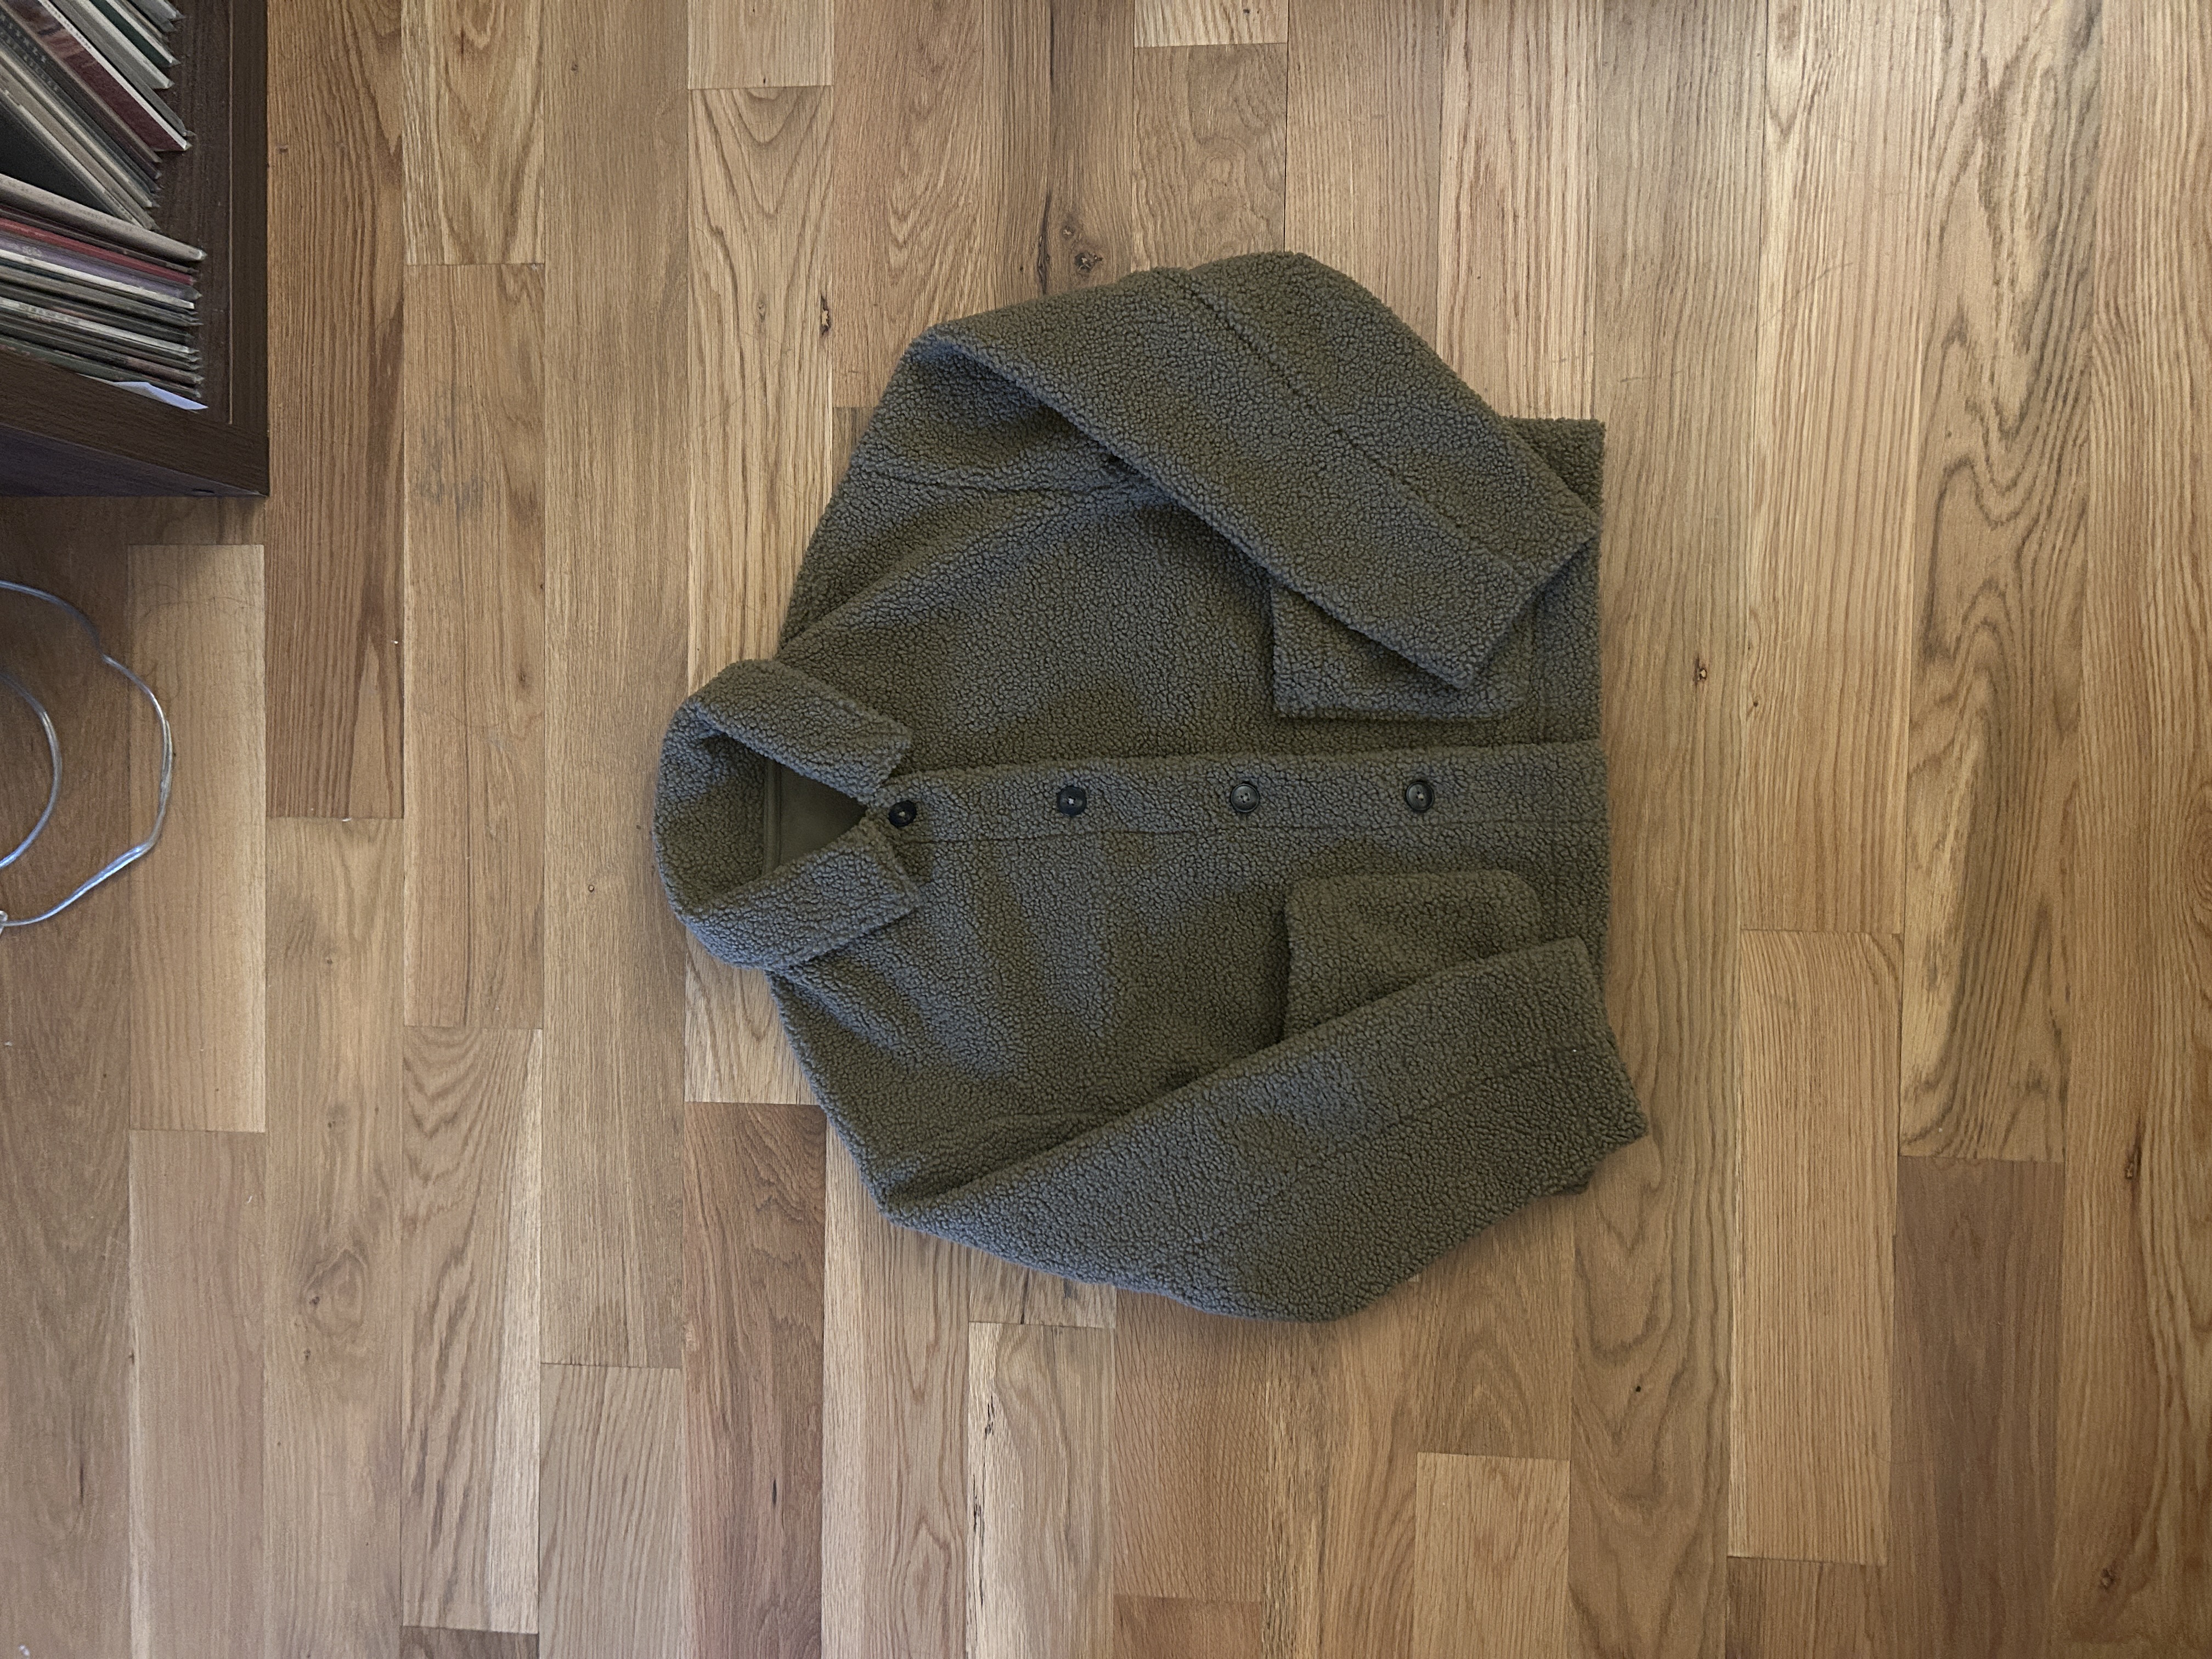
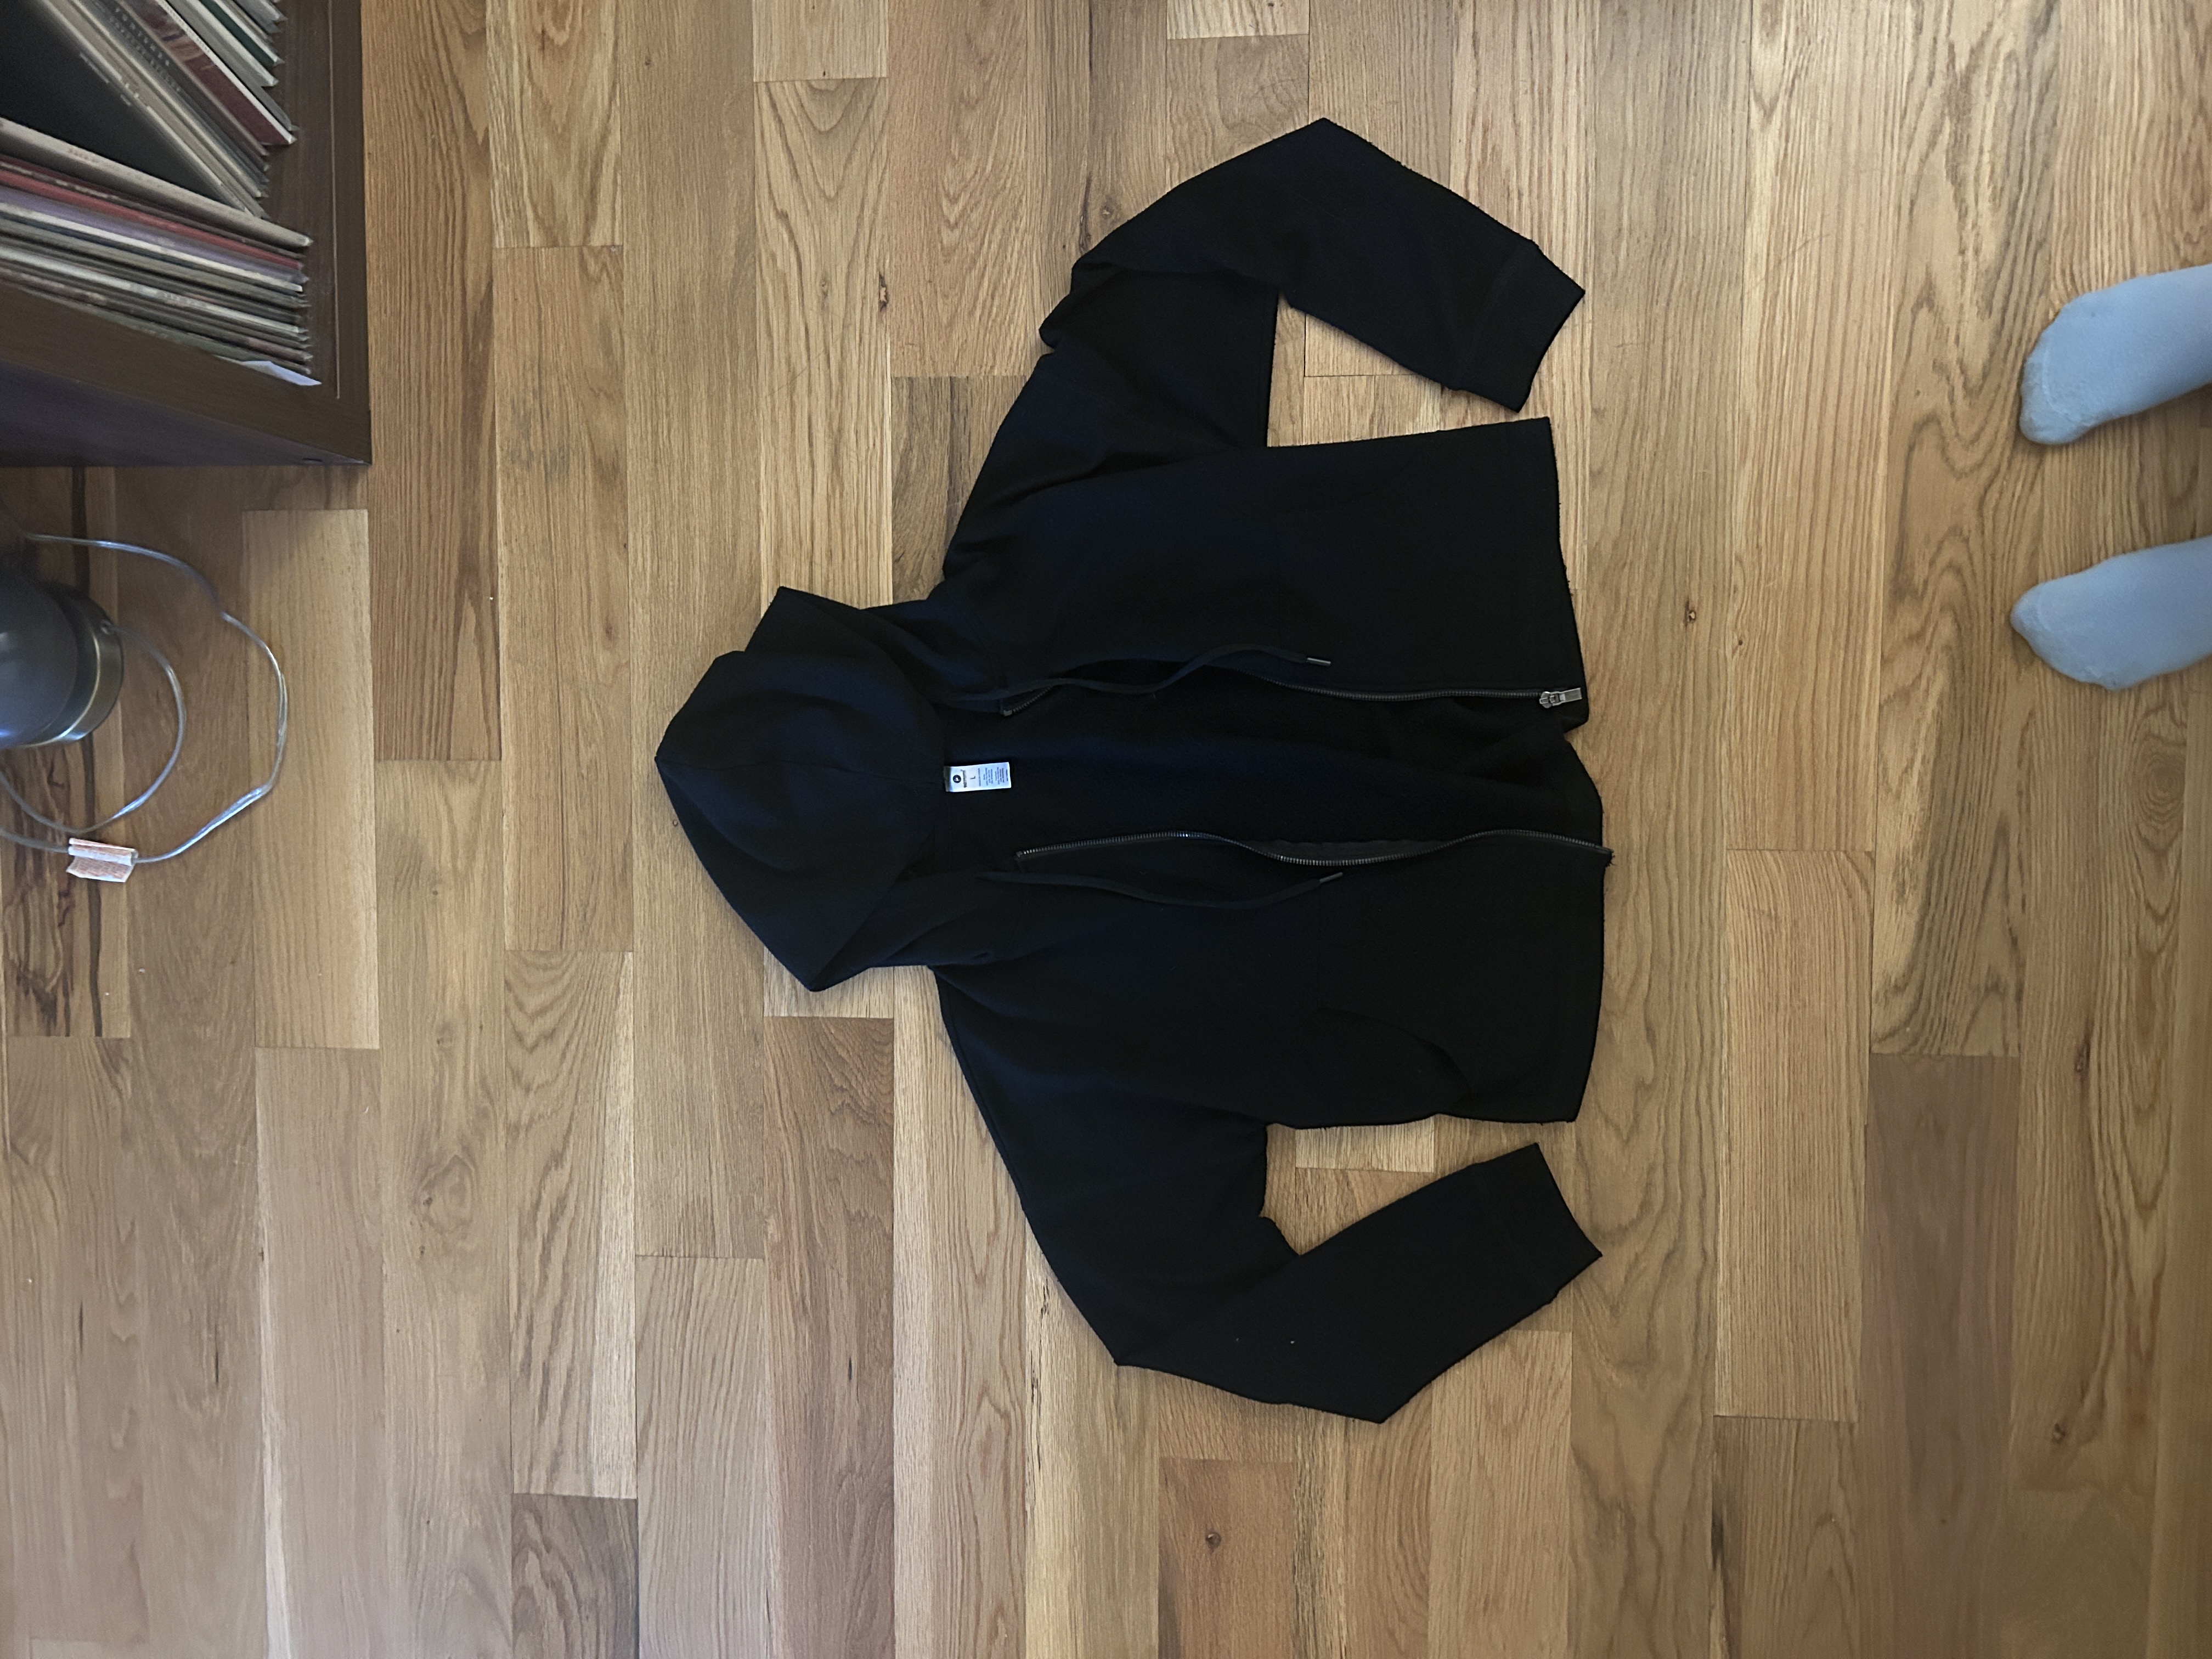

I removed the backgrounds and uploaded them to my sketch. From there, I wrote the logic that would show each image when it was recommended for that temperature range. This is the code for range 2 & 3:

After that. all that was left to do was resize the images and change the colors a bit. I’m pretty happy with the end result. If I were to take it a step further, I’d like to incorporate the rain forecast to make it more accurate, and include a note to bring an umbrella if the forecast predicted rain.